The Crypto Fear and Greed Index is a useful tool for those who might want to make a trading decision that intends to catch moments when market price overshoots on a short-term basis. Greed and fear can cause price to deviate from long-term price ranges, and this offers an opportunity to enhance returns by selling crypto during market bubbles, or buying coins during price dips.
What Is the Fear and Greed Index?
The Crypto Fear and Greed Index collates data from six measures of market sentiment. It then processes that data through a series of equations to generate one number value that reflects the overall mood of Bitcoin investors. This number ranges from 0 to 100, with 0 representing peak fear, 100 representing peak greed, and 50 reflecting that the mood of the market is neutral.
The highest-recorded reading of the index is 95, which was posted on 26th June 2019, and 6th December 2022. The lowest, most fearful reading of the index occurred on 22nd August 2019, when the index reached as low as 5.
One characteristic of the index is that it can swing from one end of the spectrum to the other quite rapidly. On 5th June 2019, just 21 days before posting the joint all-time high of 95, the index was firmly at the fearful end of the spectrum and reading 27. This high degree of volatility within the index ties in with the underlying nature of the crypto markets, where investor sentiment can shift dramatically in a short space of time.
Comparing Fear and Greed Indices
The Crypto Fear and Greed Index has similar aims and protocols to the more widely known CNN-generated Fear and Greed Index, which measures sentiment in traditional financial markets. There are, however, some notable differences in the methodology used by the respective indices.
The CNN index updates in real time, while the Crypto Fear and Greed Index updates according to a strict schedule, refreshing every eight hours at 00:00, 08:00 and 16:00 UTC. This allows crypto traders to note the moment that the latest reading is released as the update might trigger trading opportunities.
What both indices have in common is the intention to highlight to investors those times when fear or greed have gone too far. Those can be opportunities to place trades that take advantage of the wider market being ‘irrational’.
An ‘extreme fear’ reading in both of the indices can suggest that investors are too worried, and that it represents a chance to buy at the bottom of the market. Alternatively, when the indices are reporting ‘extreme greed’, investors could be suffering from a bout of euphoria and the market could be due a correction.
How Is the Crypto Fear and Greed Index Calculated?
Up to six different technical indicators are used to calculate the Crypto Fear and Greed Index. They relate to price volatility, market momentum, social media, Bitcoin dominance, trends and surveys. Alternative.me at its discretion adjusts which metrics are included in its analysis and, for example, from October 2022, ‘surveys’ data is being omitted from the final calculations.
Each of the metrics is given a weighting. The volatility and market momentum readings, for example, both make up 25% of the total figure, while trends and dominance both have a 10% weighting.
- Market Momentum/Volume (25%): The volume of current trading activity and market momentum are also compared to the average reading for the previous 30 and 90 days. A deviation from the longer-term averages in a positive market is categorised as being a sign that greed is the dominant sentiment within the market.
- Volatility (25%):This measures price volatility and maximum price drawdowns in the BTC market. The current volatility levels are compared to the average values recorded over the previous 30 and 90 days. When incorporated into the index, higher volatility is categorised as being a sign of increased levels of fear.
- Social Media (15%):Algorithms and text analysis methods are used to monitor crypto-related traffic on social media platforms. The reporting currently focuses on Twitter but is expected to be extended to include Reddit in the future. An uptick in the number of posts relating to specific hashtags and shorter response times by other posters is considered to reflect increased public interest in the Bitcoin market and that greed is on the rise.
- Trends (10%): Analysing Google Trends data can help establish the sentiment of online searches. Alternative.me gives the example of an increase in the search volume for ‘crypto price manipulation’ as being a sign that fear is increasing in the market and would be reflected accordingly in the index.
- Dominance (10%): As the first crypto, Bitcoin has a dominant position in the sector. Despite there now being approximately 18,000 altcoins in operation, the market capitalisation of BTC is far in excess of any of its rivals. As a result, Bitcoin is seen as the ‘safe haven’ crypto, and when its value increases in relation to the rest of the altcoin sector, this can be seen as a sign of increased fear.
- Surveys (15%): As of October 2022, this metric is not being included in the overall index reading, and there is no indication of when it might be reintroduced. During the period when it was included, it involved collating data from weekly polls of online investors who were asked to give an opinion on the crypto markets.
The managers of the index have not provided an update on how they have recalibrated the weighting while ‘surveys’ is suspended. Also, they do not report the individual readings for each of the component parts. So, while investors can gain a better understanding of the six sentiment readings that go into making up the index, the final number is the only usable output from the process. This is another difference from the CNN Fear and Greed Index, which provides value for each of its seven component parts.
How to Trade Using the Crypto Fear and Greed Index
Some of the six metrics that go up to make the Crypto Fear and Greed Index are leading indicators. The ‘trend’ feature, for example, is very forward looking as it captures the searches of those who might be interested in crypto market events or getting involved in crypto trading. This is a useful data point for those trying to anticipate what might happen to prices in the near future.
The market momentum and volatility readings are lagging indicators as they use historical data. They offer an accurate breakdown of what has happened, but not necessarily what will happen next.
The interesting mix of leading and lagging indicators that go into making the Crypto Fear and Greed Index raises questions for traders looking to use it as part of their decision-making process. More than 50% of the weighting is allocated to lagging indicators, but the leading indicators that are included offer a valuable insight into the direction in which investor sentiment might be heading.
Applying the Crypto Fear and Greed Index into trading strategies can therefore be done in two ways. The first relies on spotting a trend and using a momentum-based strategy to trade in the same direction of it. This could, for example, mean that a move from 56 to 60 is seen as a signal to buy Bitcoin. It works on the assumption that there is plenty of room for the index to move towards the greed end of the spectrum before a reversal occurs.
The alternative approach is to take a contrarian view and that when the market is experiencing extreme greed or fear, a correction could be imminent. Buy-and-hold investors may interpret times when fear is the dominant force as an opportunity to step into the market and take advantage of short-term panic to buy cryptocurrencies.
Dogecoin Price Chart – 2021-22
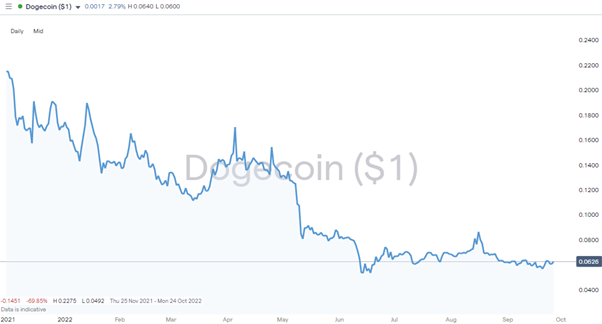
Source: IG
The way that the index is used in trading is also influenced by which coin is being traded. Some altcoins such as Dogecoin are extremely volatile, even by crypto standards. The prices in DOGE can therefore be expected to overshoot to a greater extent than the more stable and bigger Bitcoin. Those running short-term speculative strategies such as scalping may target more volatile markets as this means that profits (or losses) are made within a shorter timeframe. Capital is tied up for less time and can then be used on the next trading idea.
Case Study of the Crypto Fear and Greed Index
A quick look through the historical readings for the Crypto Fear and Greed Index adds some colour to the question of whether it is an effective indicator of future price moves. After the index bottomed out at 5 on 22nd August 2019, the price of BTC consolidated in a price range between $6,000 and $11,500, but by April 2021, investors who had bought at the bottom would have posted a staggering 496% gain.
Bitcoin Price Chart 2015-2022 – Market Rallies After Peak Fear Reading
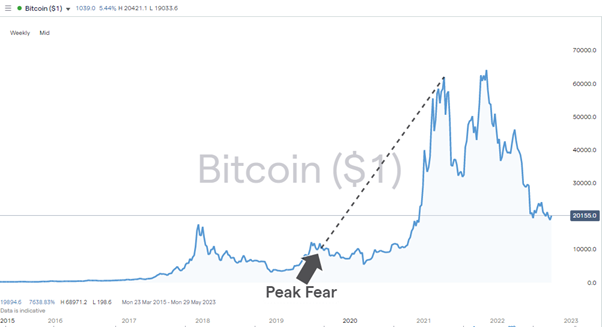
Source: IG
The approximately 12-month time lag between the peak fear reading and the price surge really taking off suggests that the correlation between the index and prices might not be as strong as it could be. However, it could be argued that the index reading of 5 marked the point that the market had bottomed out. It might not be an effective aid in terms of timing trade entry points, but it does highlight times when all the sellers in a market have booked their trades, and that the only way left for price to go is upwards.
Advantages of Using the Crypto Fear and Greed Index
Sentiment analysis is not as exact as fundamental and technical analysis, which use hard data such as interest rates, unemployment, or price data taken from the markets. While some of the sentiment indicators in the Crypto Fear and Greed Index, such as social media, have a ‘fuzzier’ feel to them, the upside of using them is that they are more forward looking.
Converting six different areas of crypto sentiment analysis into a single numerical measure means that the Crypto Fear and Greed Index is a handy tool for traders to have. It also updates at regular intervals, which means that traders can keep up to speed with market developments and track whether the index is rising or falling.
The popularity of the index is another reason for investors to consider using it. As with many indicators, if a large section of the investment community uses it, then its predictions can become self-fulfilling. Trading with the herd is important in any market, but especially the crypto market, which has a reputation for being associated with moments of widespread euphoria and panic.
Another plus point of the Fear and Greed Index is that it can be applied to a wide range of trading strategies. Whether you’re a buy-and-hold investor or a short-term speculator, having a straightforward single number allows you to quickly factor market mood into your decision-making process.
Disadvantages of Using the Crypto Fear and Greed Index
There is a risk that using the index can result in overtrading, which is definitely something that investors should avoid. Between 9th February and 5th April 2022, the index swung from greed to fear nine times. Given the wide bid-offer spreads and relatively high commissions associated with crypto markets, an investor who reversed their positions every time the index crossed 50 would have paid out a considerable amount in fees, even before the P&L on any trades is factored in.
There are also some questions that arise from the statistical methodology used. The managers of the index update the search terms used in the ‘trend’ and ‘social media’ metrics. While that might make the index a better indicator of the next move, it does mean that historical comparisons are harder, because the parameters used change over time.
One potential upgrade would be if the six different metrics were reported individually. The details of how they work are clearly laid out, but only the summary number is reported. This represents a difference of approach from the CNN Fear and Greed Index, where the seven metrics that make up that overall figure can all be analysed to a granular detail. Investors also have the option of prioritising the readings of one of the seven elements if they find that it suits their style of trading, or if one metric can be seen to be making the right calls on market direction.
The final potential weakness of the Crypto Fear and Greed Index is that it uses data relating to one crypto: Bitcoin. The fact that the managers of the index state that they are looking to expand their analysis to include altcoins reflects that this is an accepted gap in the process. Not only do insurgent coins offer greater potential returns, but they also have very different characteristics from Bitcoin.
Final Thoughts
Whether you are an experienced investor or an absolute beginner, learning how to get the most out of sentiment indicators such as the Crypto Fear and Greed Index is a great way to enhance returns. There is a risk that the process of taking six diverse metrics and turning their aggregated score into a single number oversimplifies the situation. However, there are also undeniable benefits of having one reading, which gives an instant insight into the mood of the crypto sector.
Compared to other sentiment indicators, the Crypto Fear and Greed Index does have the feel of being a work in progress. Some of the methodologies are subject to change, and metrics are included or excluded at the discretion of the index manager. This makes it harder to make historical comparisons, but at the same time gives off the feeling that the index is consistently being upgraded. That fits in with the ground-breaking nature of the crypto sector itself, so while there might be questions about some of the methodologies used, it does offer an insight into whether crypto markets are over or undervalued.
