
The Bat Pattern is like the Butterfly and the Gartley pattern as it is a 5-point retracement structure that was discovered by Scott Carney in 2001. The key difference between the Bat harmonic pattern and other harmonic patterns is the Fibonacci measurements between each point. Like other harmonic patterns, point D in the pattern is not a point but instead a zone, known as the potential reversal zone (PRZ).
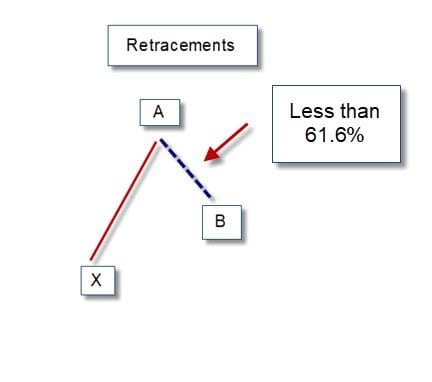
The B point retracement of the primary XA leg must be less than a 0.618, preferably a 0.50 or 0.382.
The movement of the waves to get to the potential reversal zone consists of 3 harmonic levels.
- BC is the 0.382 or 0.886 retracement of the AB line.
- CD can be either the 1.618 or 2.618 extensions of the BC line.
- The initial target which is the PRZ is a 38.2% retracement of the AD
- The second PRZ target is a 61.8% retracement of the AD line
Bullish Bat Pattern
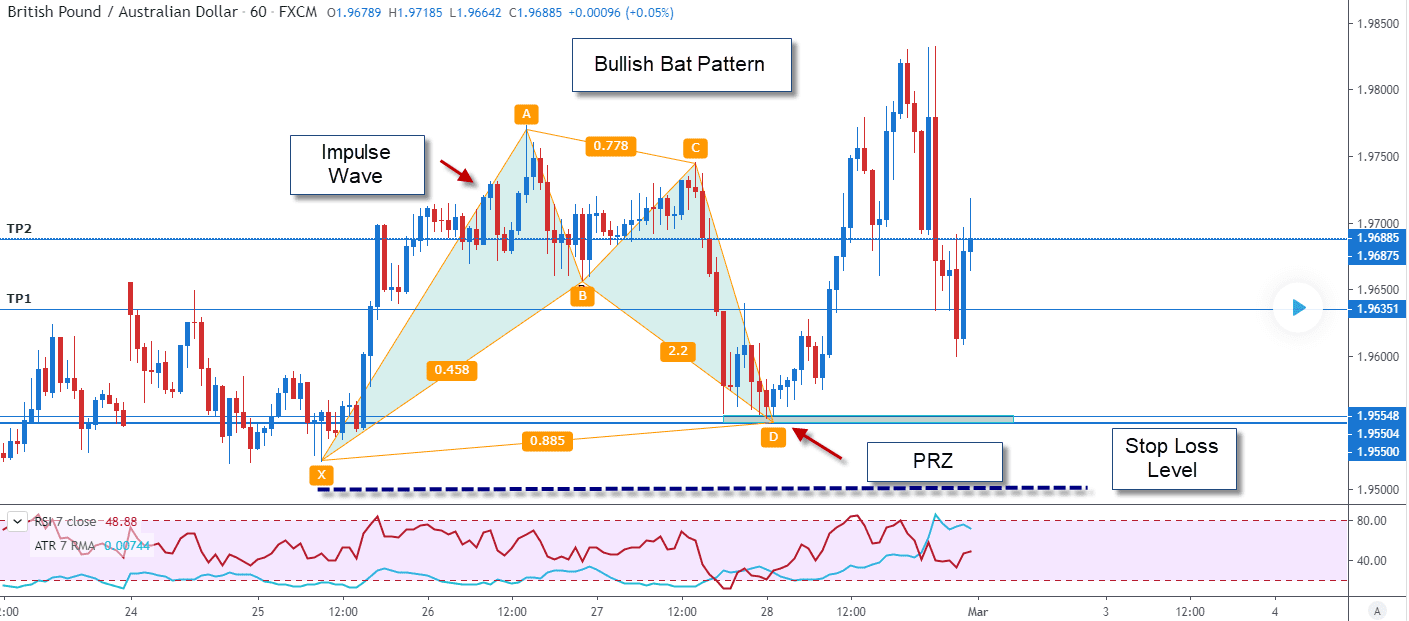
The Bat pattern has wings like a bat, creating a PRZ zone that is an 88.5% retracement of the initial XA impulse wave. Recall, the D-point is not a point is creating a PRZ where you have the discretion to purchase the currency pair GBP/AUD.
Bearish Bat Pattern
The bearish Bat pattern looks like an upside-down version of the bullish bat pattern, with the impulse wave (XA) declining from X to A, to start the 5-point XABCD pattern.
Risk Management
The Bat pattern provides you with a potential buying zone as the consolidation pattern unfolds. Like most harmonic patterns you can use additional resources such as prices outside their pattern to formulate your risk management plan. This could include overbought and oversold indicators such as the relative strength index and stochastics which creates an entry point that fits your trading style. You can place a stop loss level below the beginning of the impulse wave (X).
Key Take Away
The Bullish and Bearish BAT patterns are 5-point patterns. Like other harmonic patterns, the BAT pattern has a basic ABC pattern that follows an impulse wave XA. After the setup is created, a potential reversal zone (PRZ), point D is generated as a target range that can be a buying point and a selling point. Your stop loss level can be below the X in the impulse wave, and the entry can be used in conjunction with other technical analysis indicators.
PEOPLE WHO READ THIS ALSO VIEWED:
