A grand master will look at the whole picture and from the whole picture draw a conclusion as to the likely moves of the opposition and the outcome of the game. The chess grandmaster started out as a beginner and had to learn the basics of the game as a new trader must learn the individual candlesticks.
An experienced technical analyst will however look at a chart and take in a number of different factors in all at once and base their decision on the whole chart.
Candle Construction
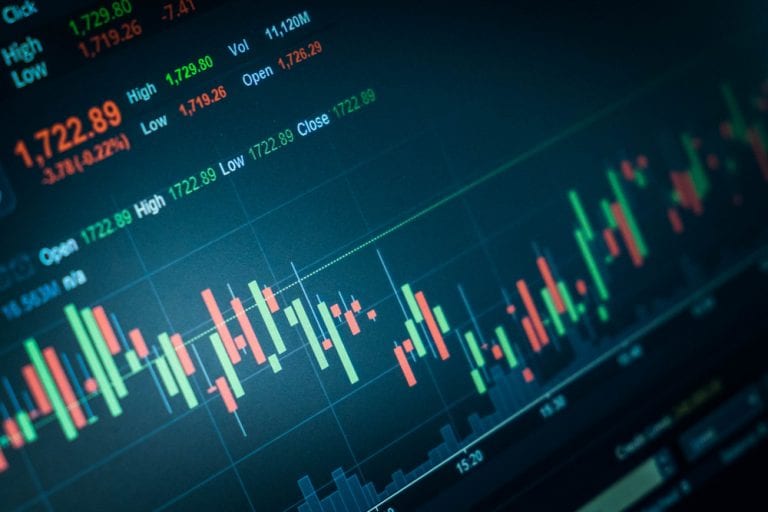
Candlesticks are very useful in that they provide a diagrammatic view of the market. It has also been discovered that the candlesticks form recognisable patterns that can be very accurate in predicting future price trend directions.
Candlestick patterns portray market sentiment and are an important component in market analysis. The following patterns are some of the ones you may recognise when studying the charts.
A candlestick is made up of a body and a shadow on the top and/or bottom. The highest price is the top of the shadow and the lowest price is the bottom of the shadow. If the candle is open then the share opened at the bottom of the body and the close is the top of the body.
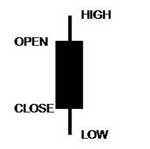
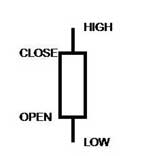

An open candle means the price went up today, while a solid candle means the price went down today.
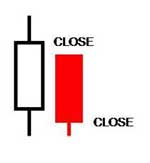
A candle is coloured green if the close today is higher than the close on the previous day. A candle is coloured red if the close today is lower than the close on the previous day. A candle can be solid and green, if the share price went down today and the close is higher than the previous day.
To generate a solid green candle the price must jump up when the market opens and then drop during the day. The drop during the day must be small enough that the closing price remains above the previous day.
A candle can be open and red, if the share price went up today and the close is lower than the previous day. To generate an open red candle the price must jump down when the market opens and then climb during the day. The climb during the day must be small enough that the closing price remains below the previous day.
Distributive Selling
Distributive selling or distribution is shown by a shadow on top of the candlestick. The shadow shows the share price went higher during the day and was then sold back down to close below the high. Distributive selling is an indication that the share is being sold and can be a warning of a trend reversal.
Accumulative Buying
Accumulative buying or accumulation is shown by the shadow on the bottom of the candlestick. The shadow shows the share price went lower during the day and was bought back up to close higher. Accumulative buying can occur for many days before a share begins to rise if a large investor wants to enter a position without pushing the share price higher.
Marobozu Candle or Shaven Head
A candle with a flat top and no upper shadow is known as a Marobozu or Shaven Head candle. This candle indicates strong buying with the share price rising throughout the day to close at the highest price of the day. It is likely the share price will continue to rise the next day.
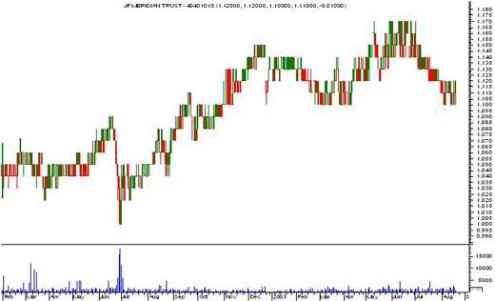
Liquidity
A liquid share is a share that is actively traded and is easy to buy and sell. It is important that when it comes time to buy or sell a share that you can act accordingly. Some shares trade such a small amount that to buy them can be difficult and selling can become a major problem.
These shares are known as illiquid. If the share is extremely illiquid you may be unable to sell the share, however in most instances this means that you sell at a much lower price than where you wanted to sell.
Candlesticks can give some indication of how illiquid the share is. Small dashes in the candles or extremely long candles can indicate a low volume share. Which shares are illiquid or difficult to buy and sell depends on the amount of money that you are trading.
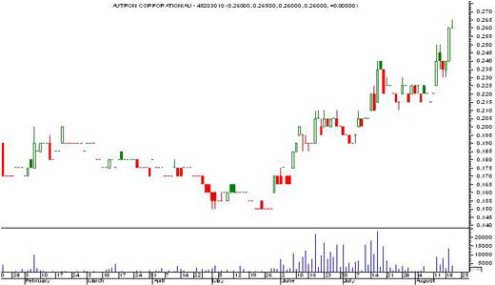
Blocks in the share price can also indicate low volume shares with the share meeting resistance at every movement. These shares are unlikely to be great trading shares as they move slowly and in very small ranges.
Candlestick patterns can be used to identify when to buy a share. Common patterns that suggest a reversal in direction of the share price are shown below.
The Good Old Hammer
The hammer has a small body with a long lower shadow at least two to three times longer than the main body. The colour of the pattern can be either red or green and the candle can be open or solid. The hammer is a common candlestick pattern that is found in the market and very reliable.
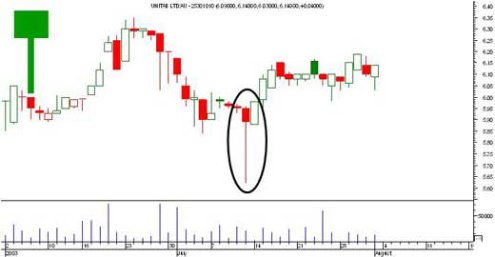
The hammer indicates that the share is likely to reverse direction when seen after a strong fall in the share price. The hammer shows that the share price fell strongly early in the day to reach a new low level.
At the bottom of the shadow the buyers stepped in to buy the share back up, near to where it opened. This wave of buying often reverses the down trend and the share is now likely to rise. Buying on this candlestick signal alone is an aggressive approach to trading.
The Famous Doji Star
The doji (pronounced doe -gee) is formed when the opening and closing price for the day are the same. The share price moved higher and/or lower during the day however the closing price was the same as the opening price.
The colour of the doji can be either red or green. The doji is a reversal pattern, which signals a balance between supply and demand.
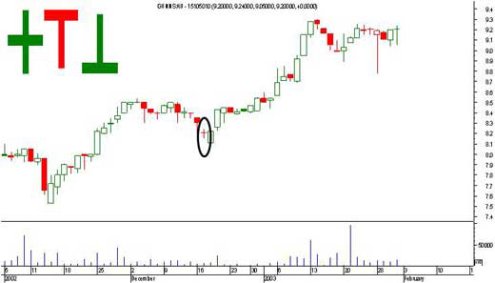
Buyers cannot push the share higher and sellers cannot push the share lower indicating balance. Doji patterns appear many times and it is important to confirm the change in trend before acting on this pattern. If there are many doji present it signals the price is in balance and will crab sideways.
Piercing Line Pattern
The piercing line pattern is a reliable reversal pattern. The first candle is solid and red followed by the second candle being open and green.
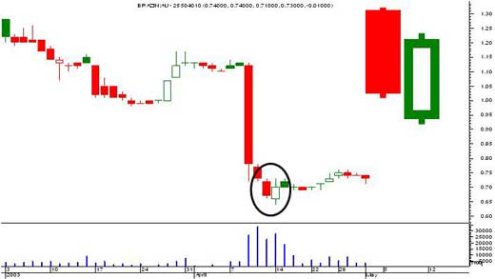
The share price has gapped lower at the open on the second day and then climbed up to close higher than the middle of yesterday’s candle.
In the market, yesterday’s price movement has been ignored and the share price has reversed direction. This pattern is a reliable indicator of a change in trend.
Bullish Engulfing Pattern
The bullish engulfing pattern is a reliable buy signal. The first candle is solid and red followed by the second candle being open and green.
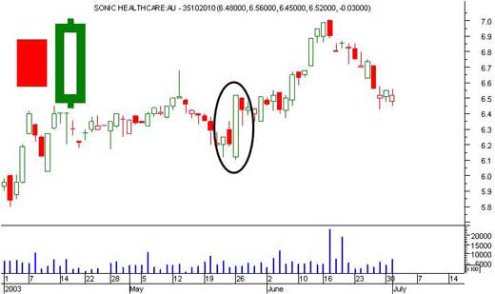
The price gaps lower on open and then closes higher than yesterday’s close. This pattern indicates a complete reversal in direction and is a very reliable indicator of a change in trend. This pattern can also known as an outside day when using bar charts.
Always look for Confirmation first
All the patterns discussed indicate a possible trend reversal and confirmation of a change in trend should be found before buying or selling shares. In the case of seeing a hammer after a strong fall a conditional buy order can be placed above the shooting star.
This means you will sell the share if it climbs the next day. A more conservative entry strategy is to wait for the next candle to confirm the change in trend before placing a buy order. Be aware that a hammer in a downtrend does not always mean that the share is not going to go any lower than the current price. It can often mean the share is going to rest for a few days or weeks before it continues to fall.
To confirm a change in trend consider the volume traded on the day of the candlestick pattern. If large volume has been traded it is more likely that the pattern will be significant, than if only a few shares are traded on that day.
Candlestick patterns can often occur at support or resistance or near a trend line or channel line. These tools can be used to confirm the significance of a candle.
Finally the clearer the pattern the more likely it is that the share will reverse. If it is difficult to see the pattern or distinguish the validity of a pattern then it is far less likely to indicate a reversal than a pattern that is very clear and obvious.