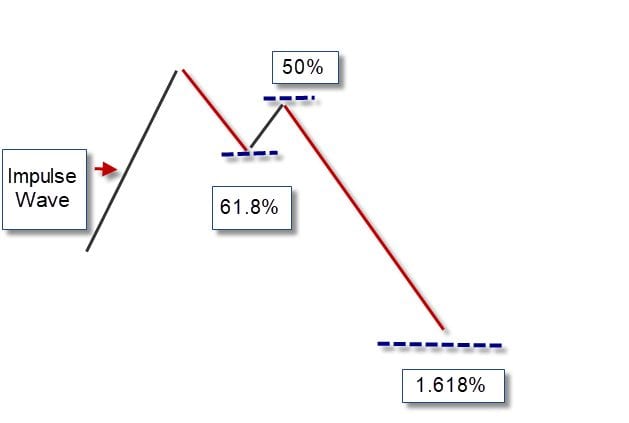
Scott Carney discovered the Crab pattern in 2000 a year before he introduced the Bat pattern. Like other harmonic patterns, the Crab pattern is a 5-point extension structure that can be used to trade stocks, forex, or anything else with continuous price action. The Crab pattern has well defined Fibonacci measurements which designates each point in the pattern. As with most harmonic 5-point pattern level D is not a point but instead is a zone referred to as the Potential Reversal Zone (PRZ).
- AB should be the 0.382 or 0.618 retracements of the XA line.
- BC should be either the 0.382 or 0.886 retracements of the AB line.
- CD is the 2.24 or 9.64 extension of the BC line.
PRZ consists of 3 converging harmonic levels
- 618 extension of the primary XA leg,
- AB=CD pattern, either equivalent, 1.27 or 1.618 and

The target for profit on the Crab pattern is a 38.2% retracement of line AD. The second target is a 61.8% retracement of line AD. The first target would be the 382 retracements of AD and the second target the 618 retracements of AD. Common stop levels are below D point.
Risk Management
The Crab pattern provides you with a potential buying zone, but you are buying as the market falls, like a diving knife, or selling as it is surging. More than any other harmonic pattern, the stop loss level is hard to determine and likely requires other price action to determine the appropriate stop loss level. You should consider using this pattern with other indicators such as the relative strength index or stochastics to make sure the market is oversold or overbought before entering a position.
Key Take Away
The Bullish and Bearish Crab patterns are 5-point patterns. The Crab pattern has a basic ABC pattern that follows an impulse wave XA. After the setup is generated a potential reversal zone (PRZ), point D is generated as a target range for buying and selling. This pattern requires that you buy as the market is falling or sell when it is rising which requires prudent stop-loss levels.
PEOPLE WHO READ THIS ALSO VIEWED:
