
Gravestone Doji candlestick patterns occur when there is rising potential for a bearish reversal in the market price of an asset. In order for a Gravestone Doji pattern to develop, the market must first experience upward price trends. However, this period is quickly followed by a downward movement in the market’s underlying price valuation and successful traders can use these events as a signal short the asset for potential profits in coming sessions.
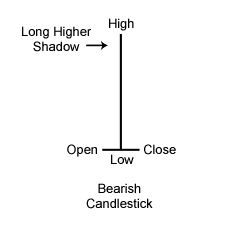
Gravestone Doji patterns are formed when an asset’s opening price, closing price, and price low are all near the same value. The pattern is also characterized by a long upward shadow (determined by the price high of the trading period), which suggests an initial bullish advance that lacked follow-through and resulted in minimal price movement by the close. As bearish traders are victorious by the end of the session, its not surprising that a longer-term downtrend will be expected and this is why short positions can be initiated for the asset.
Essentially, the Gravestone Doji implies that bearish reversal prospects are building and traders that are holding long positions should consider closing the trade. Values in the opening price, closing price, and price low are not required to be exactly equal in order to reach confirmation. However, there should only be a very small on the bearish side of the Japanese candlestick pattern because larger extensions could create a spinning top, inverted hammer, or shooting star candlestick pattern.
Chart Example: Gravestone Doji Candlestick Patterns
Traders can use the Gravestone Doji pattern as a signal to initiate short positions, and these signals are even stronger when they appear at the conclusion of a previous uptrend. If trading in stock markets, traders might also look at price patterns in conjunction with volume levels. However, traders in commodities markets, cryptocurrency markets, or foreign exchange markets can also use this powerful chart pattern when trading on any time horizon.
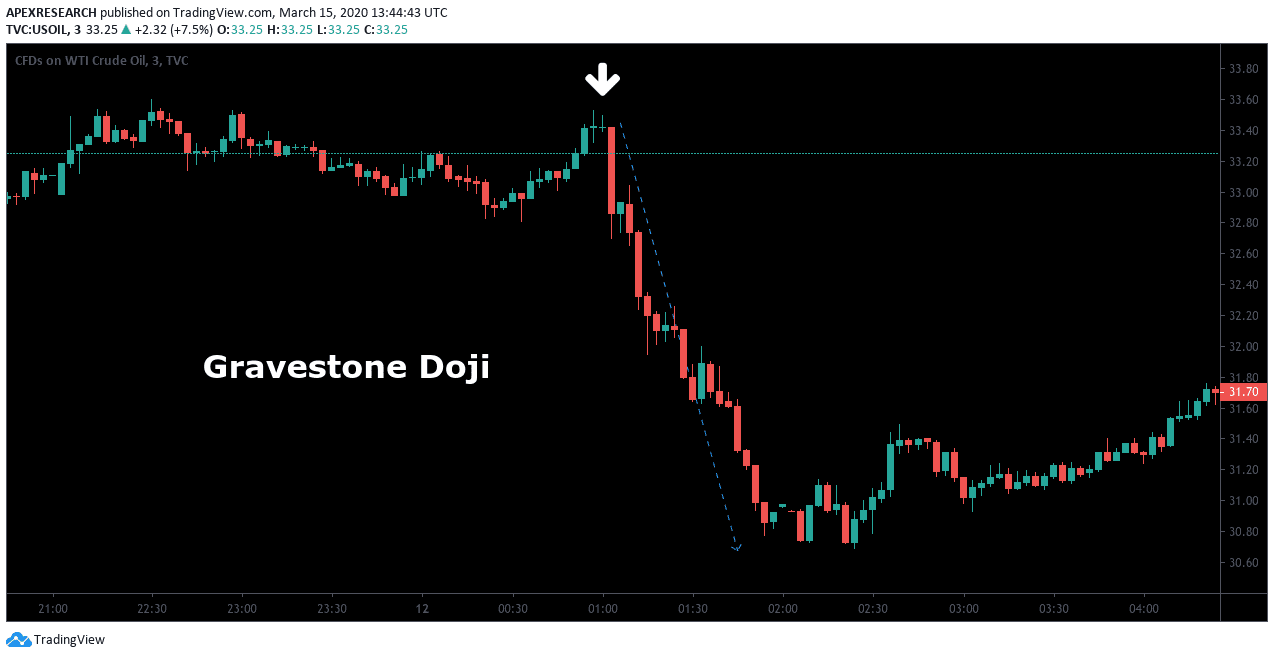
In this chart example, a Gravestone Doji pattern predicts a strong breakdown in the price of oil. To the left of the chart, market prices are trading in a sideways pattern (or price consolidation period). Once prices start to make a small move higher, bears quickly move in and establish short positions that are large enough to create a new downward trend in prices. As a protective measure, traders could use a stop-loss order that is placed above the high of the upper wick that is created by the price pattern.
Ask Traders Summary: Gravestone Doji Candlestick Patterns
- Gravestone Doji candlestick formations signal a price bearish pattern indicating strong reversal potential that results in a downtrend in the market.
- Gravestone Doji patterns are a signal to take profits (on long positions) or to establish short positions based on expectations for an upcoming downtrend.
- In contrast to the Dragonfly Doji, the Gravestone Doji pattern suggests sentiment in the market is likely to turn negative (which indicates a bear market environment).
- When conducting live trades, it is important for investors to implement stop-loss orders as a protective measure.
- In practice, stop-loss orders can be placed above the high of the upper wick that is created by the Gravestone Doji candlestick pattern.
PEOPLE WHO READ THIS ALSO VIEWED:
