
MFI provides key insights into the amount of money that flows into an asset over a certain period of time, which allows traders to assess market trends in a way that is unique to this indicator. In this Money Flow Index guide you’ll learn more about this useful indicator, including:
- What the MFI indicator is
- How to use it when trading
- Advantages and disadvantages
What Is the Money Flow Index?
The Money Flow Index (or MFI) is a technical indicator that measures the price momentum of an asset by comparing its total inflow and outflow levels over a specified period of time.
The Money Flow Index integrates volume as an additional metric that works in conjunction with the standard price calculations that are found in the Relative Strength Index (or RSI).
For these reasons, traders might often encounter academic studies that compare the various strengths and weaknesses typically associated with these popular technical analysis indicators.
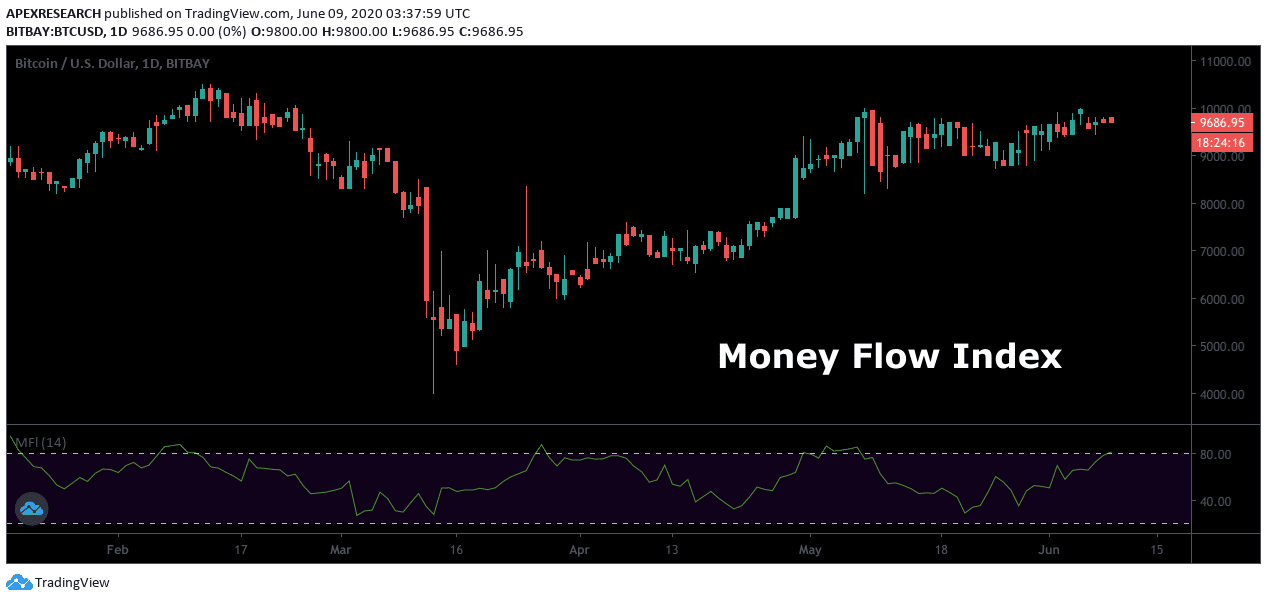
Like most traditional oscillators, the demarkation values that are found in the Money Flow Index will range from 0 to 100. Indicator readings above 80 are usually considered to be overbought, while readings below 20 are usually considered to be oversold.
Similar to the Relative Strength Index, the Money Flow Index compares the number of bullish trading periods to the number of bearish trading periods.
However, the main difference between these two indicators lies in the fact that MFI calculations are based on market volume, whereas RSI calculations are based only on asset prices themselves.
How To Use It?
In practice, expert traders will often use the Money Flow Index as a way of spotting contrarian divergences as they become visible in the market.
Divergences occur when technical indicator readings begin to disagree with the underlying trends found in market prices. Ultimately, these events are critically important because they can signal a potential end to the market’s dominant price trends.
In this way, the Money Flow Index can be especially useful for contrarian traders looking to establish reversal positions in the market.
Market investors can also base trading strategies on the overbought and oversold readings that are generated by the oscillator. In these cases, conservative traders might wait for extreme readings before taking an active position. For example, Money Flow Index readings above 90 (heavily overbought) or below 10 (heavily oversold) might offer strong trading signals but they are relatively rare in the market.
In contrast, more aggressive traders might opt to establish buy positions when MFI readings fall below the 20 level or begin to short-sell the asset once the indicator moves above the 80 level.
In these cases, market positions can be taken more frequently and this is why individual trading styles can have a significant on the ways the Money Flow Index might be used in active trading.
While comparisons are often made between the Relative Strength Index and the Money Flow Index, this doesn’t necessarily mean that these indicators should be used in combination with one another.
More commonly, expert traders will pair the Money Flow Index with chart-based analytical tools like the Keltner Channel because it offers an alternative viewpoint on the dominant market trends.
However, the most common strategies tend to center around divergences and overbought/oversold reversals and the charts below show two examples of these events.
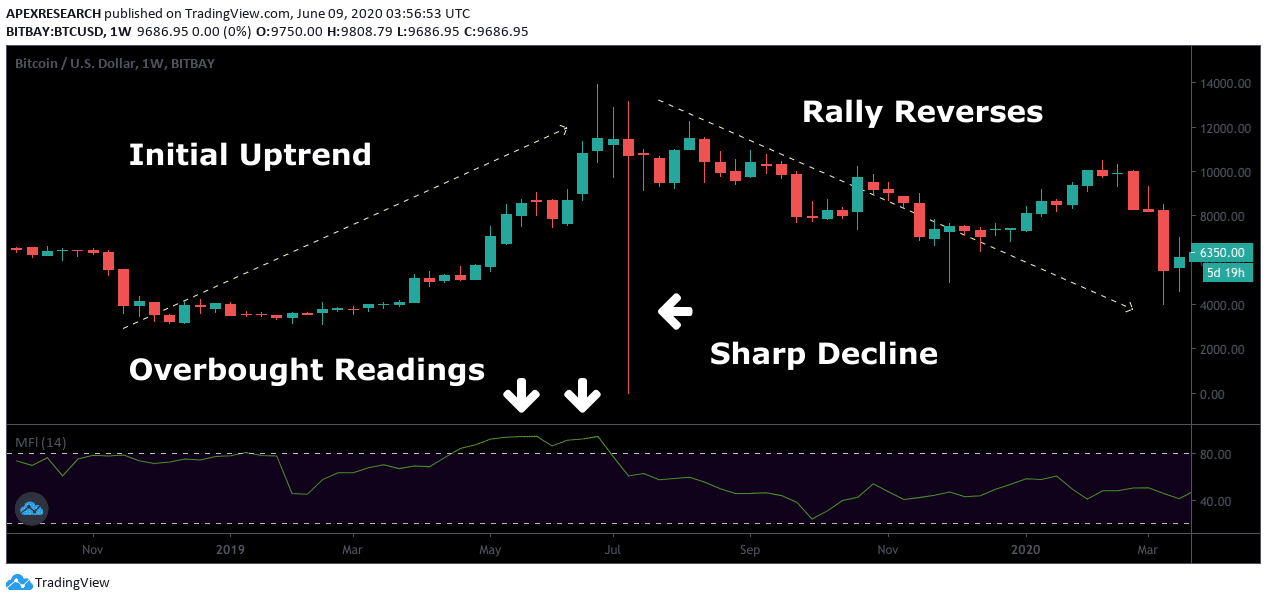
In this trading example, market prices show an initial uptrend rally until readings in the Money Flow Index begin to send warning signals.
Once the Money Flow Index moves into overbought territory, market prices have tremendous difficulties retaining the same bullish momentum.
Next, a sharp decline in prices foreshadows an end to the initial uptrend. In this scenario, traders could have taken short positions once the Money Flow Index suggested the potential for weakness in the sessions ahead.
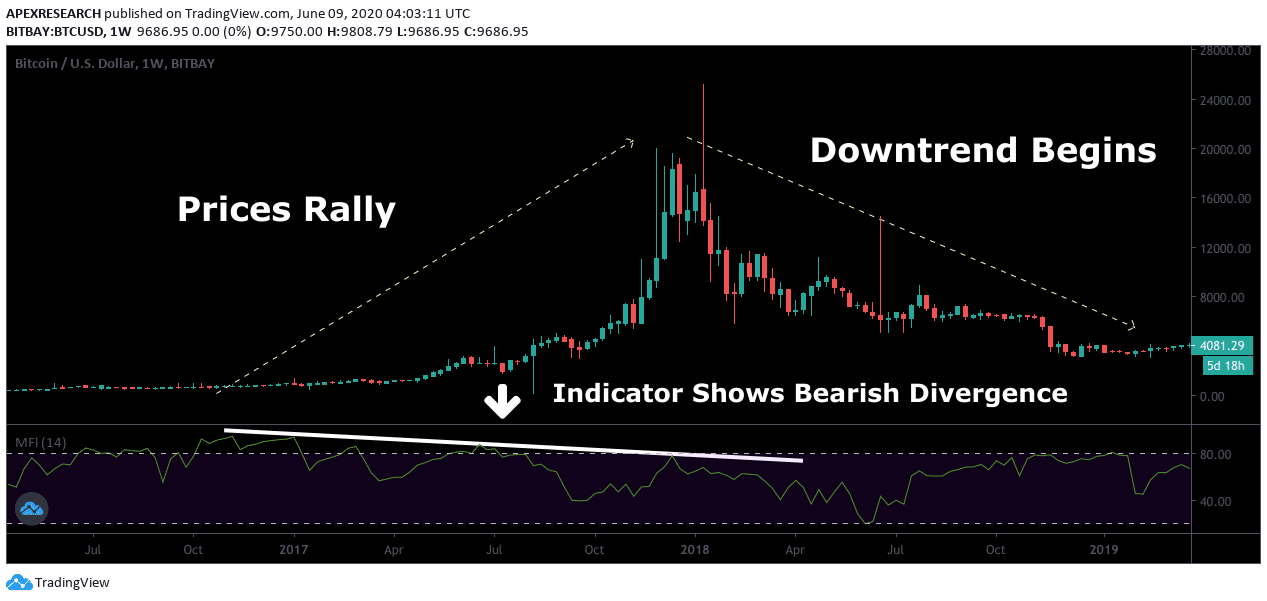
In the second trading example, we can see prices move higher in a long-term uptrend even as indicator reading flash clear bearish divergences.
Ultimately, the initial price rally proves to be unsustainable and a downtrend eventually overtakes the market.
In this scenario, traders could have established short positions based on the clear disagreements visible in market price trends and the asset’s Money Flow Index readings.
Advantages
Money Flow Index readings build on the traditional strategies associated with the Relative Strength Index.
Once indicator readings become overbought or oversold, traders are able to identify divergences that go beyond simple changes in market price.
These divergences are often used as the basis for reversal trading strategies and this is why the addition of a volume metric can be highly useful for traders with many different investment styles.
Unlike most of the traditional oscillators used in technical analysis, the Money Flow Index incorporates changes in transactional flows and this information allows traders to assess market trends in a way that is highly unique and generally specific to this indicator.
Disadvantages
At the same time, the Money Flow Index will sometimes generate false signals, and this can lead to unexpected losses in certain market environments.
For example, an MFI divergence might not necessarily result in a reversal in market prices. Alternatively, and overbought or oversold reading might not necessarily signal the end of a prior market trend.
For these reasons, expert traders will usually recommended implementing additional forms of technical analysis to confirm indicators readings and control risk as the potential for unexpected volatility rises.
Conclusion
As a unique momentum indicator in the field of technical analysis, the Money Flow Index provides key insights into the amount of money that flows into an asset over a certain period of time.
Originally, the Money Flow Index was designed to identify potential reversal points that might not be obvious using the traditional trend-following systems that are popular in technical analysis.
Expert traders usually recommended combining the Money Flow Index with other indicators capable of identifying price reversals as a confirming strategy before live positions are taken in the market.
In this way, traders can help raise the level of accuracy in an operational strategy while limiting the number of false signals that are generated by the indicator.

Summary
- The Money Flow Index is an oscillator that produces trading signals (overbought readings, oversold readings, and divergences) using both volume and price data.
- Indicator readings of 80 and above are typically considered to be overbought, whereas readings below the 20 level are considered to be oversold. Conservative traders might opt to use threshold levels that are even more extrend (with the 90 level signaling overbought conditions and the 10 level signaling oversold conditions).
- Money Flow Index readings can also indicate divergences with the underlying market price of an asset and these trading signals can be highly useful in establishing contrarian reversal positions.
PEOPLE WHO READ THIS ALSO VIEWED:
- XTB review
- Morning gaps in day trading
- Equities – using a discounted cash flow model
