
In this article we will explore the Triple EMA and:
- Define the Triple EMA
- Explain the calculation for the Triple EMA
- Highlight its uses in trading
What is Triple EMA
- The Triple EMA is a technical analysis indicator that can help to recognise trending markets.
- The Triple EMA is calculated from three exponential moving averages, each calculated from an initial exponential moving average calculation of price
- The indicator can give signals for
- Trend direction
- Support and resistance
- The start of new trends
- The end of mature trend
- As with all moving averages, the Triple EMA is a backward-looking indicator, based on previous price action.
- By using the multiple calculations for the Triple EM, however, the lagging effect is reduced.
- The Triple EMA is not very useful in a non-trend, consolidation stage (as with most moving averages tools).
Important note: The similarly named Three EMA System, or Three EMA Crossover System is NOT the same as the Triple EMA.
Calculating the Triple EMA
The calculation for the Triple EMA (Exponential Moving Average) is as follows
Triple EMA = (3 x EMA1) – (3 x EMA2) + EMA3
Where:
EMA1 = Exponential Moving Average (with lookback n periods)
EMA2 = EMA (with lookback n periods) of EMA1
EMA3 = EMA (with lookback n periods) of EMA2
- EMA1 is calculated from price with lookback period n (n could be 9 for short-term trades, or 55 for intermediate-term trades)
- EMA2 is calculated as the EMA of EMA1 (with the same lookback period n)
- EMA3 is calculated as the EMA of EMA2 (with the same lookback period n)
- These values are entered into the Triple EMA formula above to calculate the Triple EMA
Using the Triple EMA
The Triple EMA is a trend following system, which can be used in a number of ways.
Figure 1: Daily S&P 500
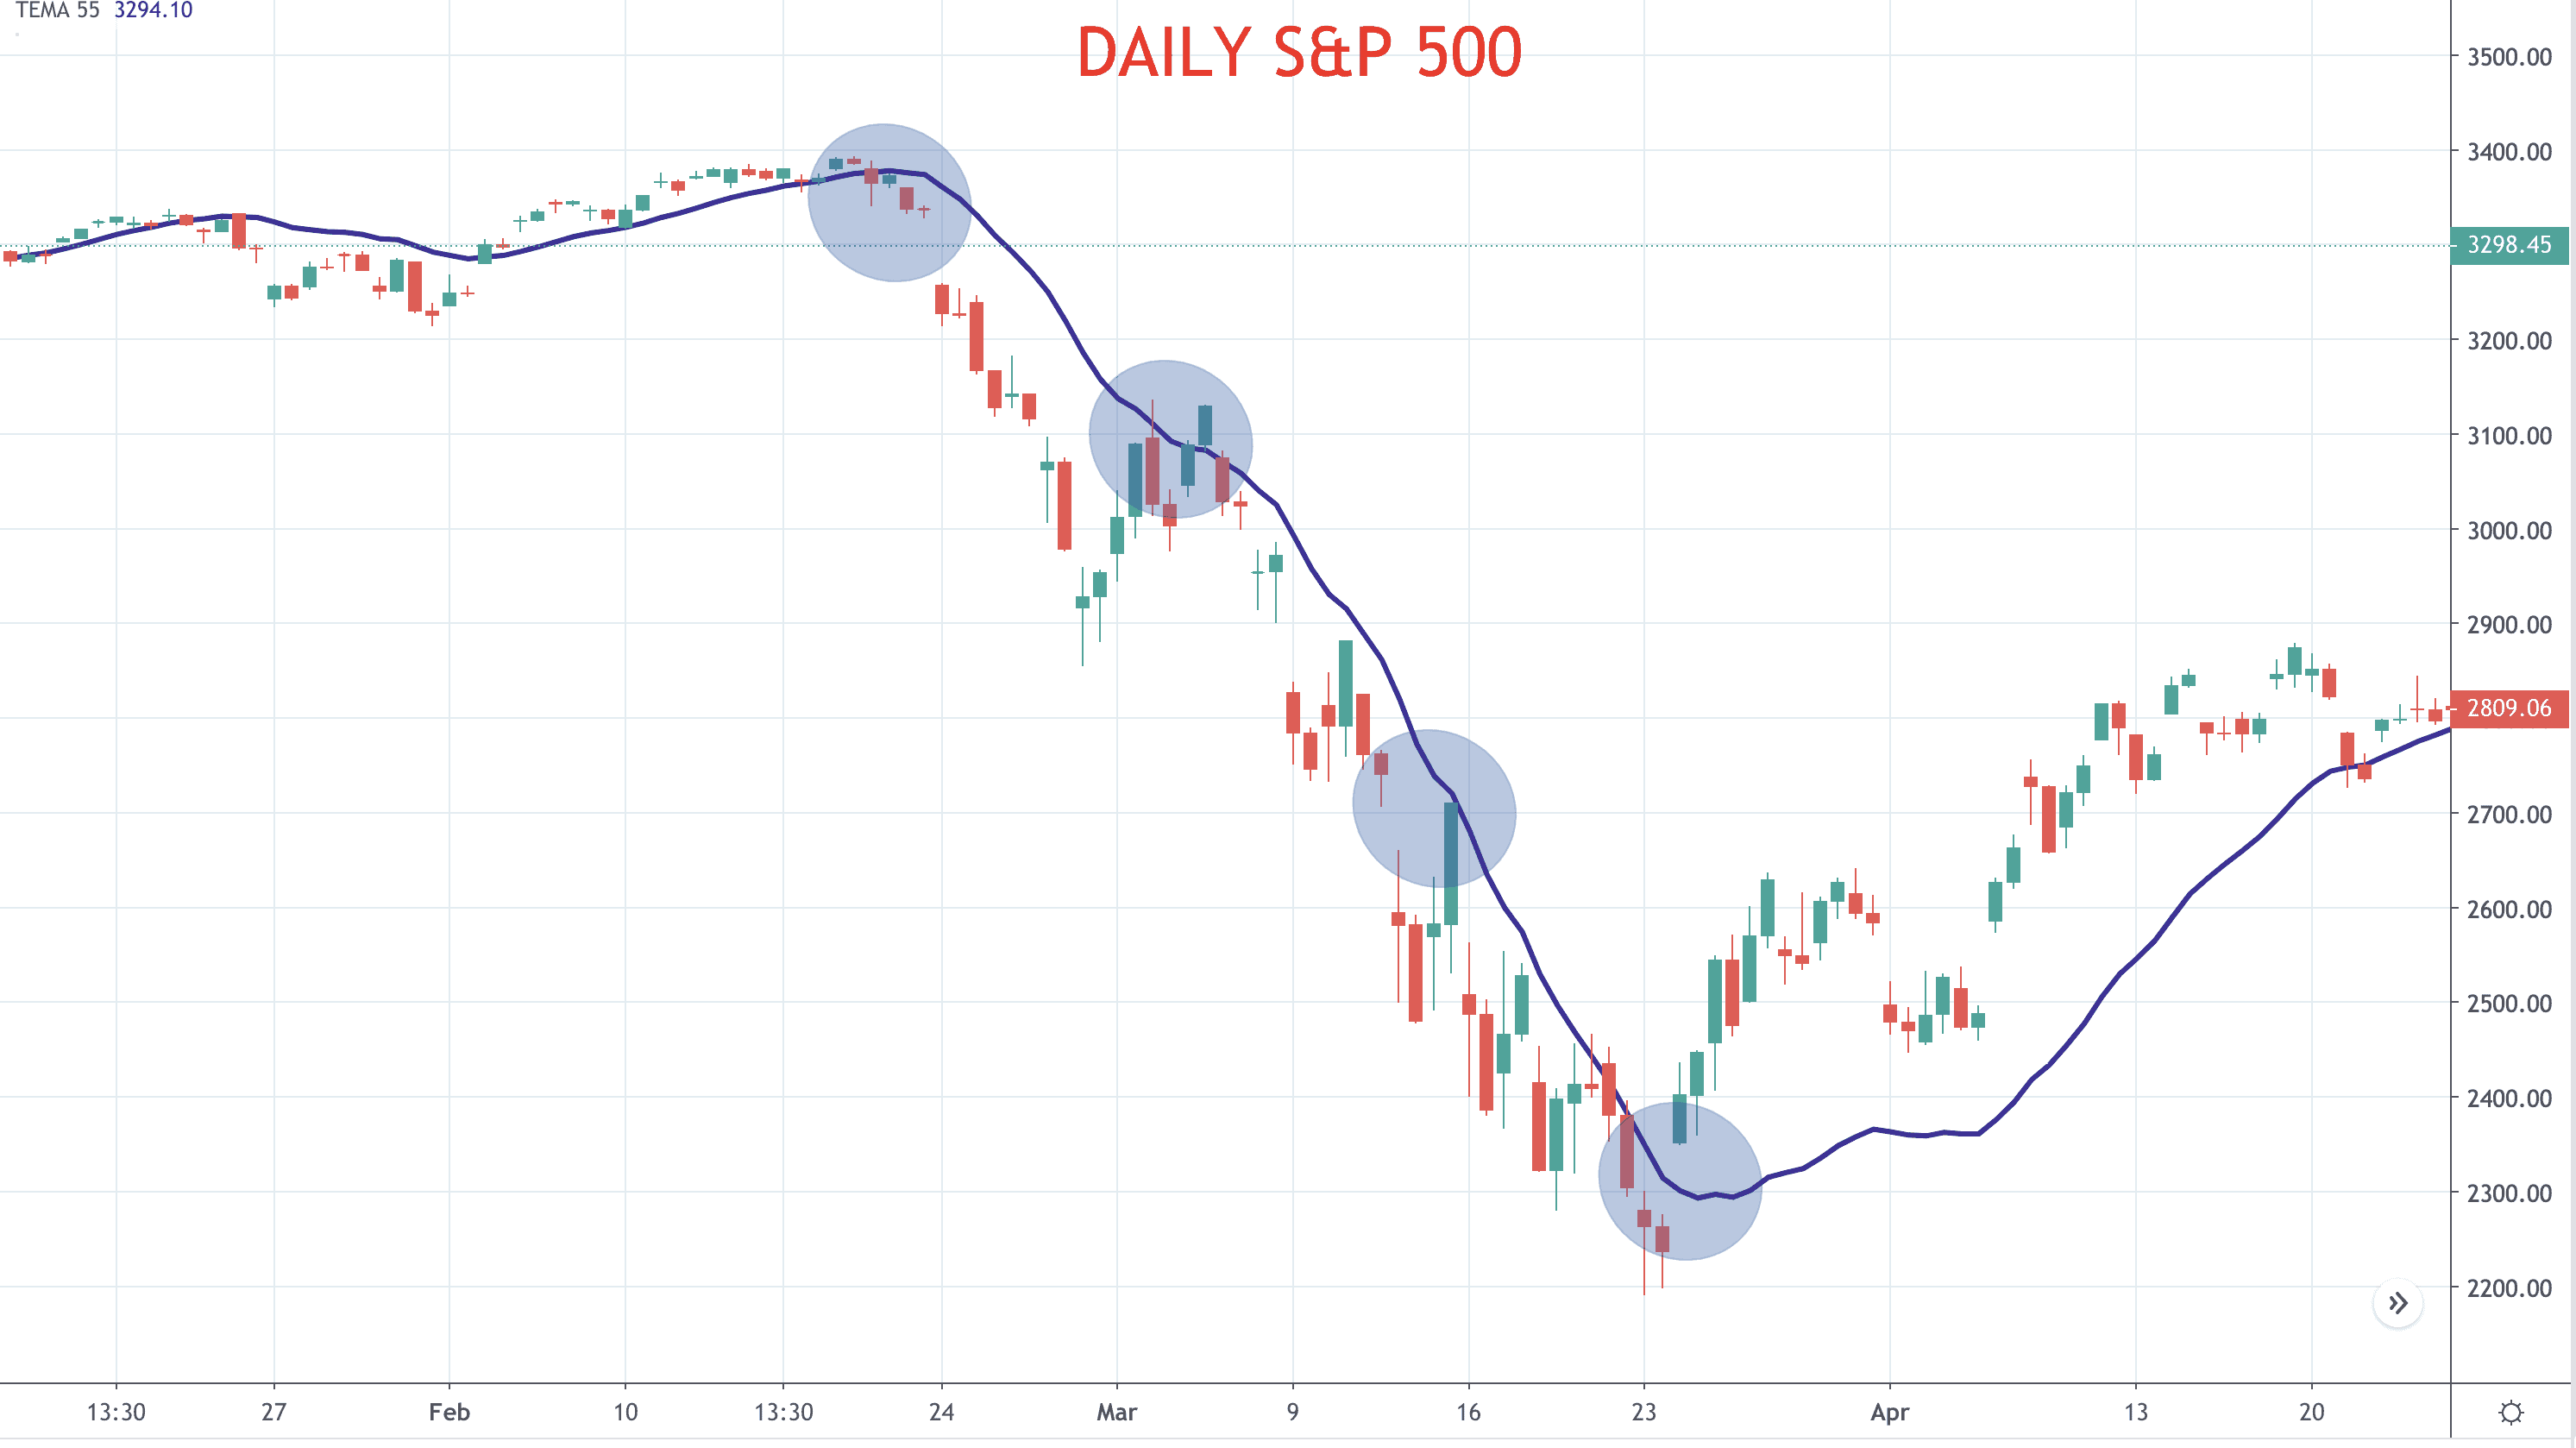
- Trend direction – If the Triple EMA is pointing lower, the trend is seen to be down, if the Triple EMA is pointing higher, the trend is seen to be up.
- Support and resistance – If the Triple EMA is below the current market price it acts as support, if it is above the current market price it acts as resistance, as can be seen in Figure 1 above.
- Signals – Breaks above and below the Triple EMA and/ or changes in direction of the Triple EMA can be used as trading signals (see our article on the Triple EMA as a trading strategy)
In Summary
- The Triple EMA signals market trend
- It provides support and resistance levels for trade entry and exit levels.
- The lagging effect that is experienced with Simple or Exponential Moving Averages is reduced Triple EMA System.
- The Triple EMA System is less useful in non-trend, sideways markets.