
What is a Chart Pattern?
A chart pattern is a visual way of displaying movement patterns in a price chart. Traders use them to understand what direction a price is likely to go in based on past performance. They are useful as they help us to determine potential entry and exit points on a security. As the balance of power shifts in a market, a chart pattern begins to emerge.
- An uptrend indicates that the Bulls (buyers) are in control
- A downward trend indicates that the Bears (sellers) are in control
Chart patterns can be as short as one day or spread out over many years. Technical analysis of charts can be used to make both short and long-term trading decisions as data can be either intraday, daily, weekly or monthly.
Types of Chart Patterns
The chart patterns that traders need to be aware of fall into two main groups:
- Reversal Patterns
- Continuation Patterns
Reversal Patterns
Reversal patterns occur when prices pause before reversing in the opposite direction, indicating that the established market trend may be about to change. For example, a reversal pattern formed during an uptrend indicates that the trend is about to reverse and the price will soon head down. Reversal patterns can be either bullish or bearish.
Let's start by taking a look at Bullish patterns.
Bullish Reversal Patterns
Any trend in which the lows are higher than the previous lows is known as a bullish reversal pattern. It signals the likely reversal of the existing downtrend and indicates that the bulls (or buyers) are rallying in the market. Traders will typically look to assume ‘long’ (or buying) positions once a bullish reversal pattern has been identified and confirmed.

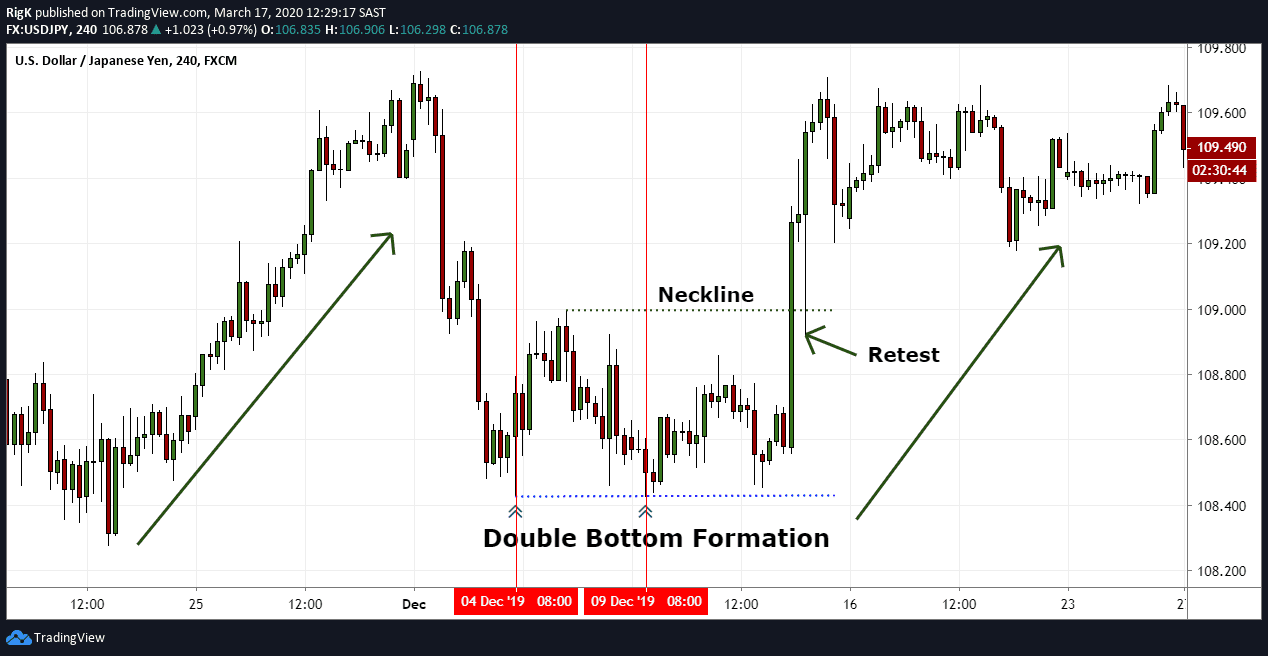
Double Bottom Pattern
In a Double Bottom, the price posts two lows near to the same level within the same downward trend, then break above the high in between the two lows. Most traders will only consider this bullish pattern to be completed if the price breaks and closes above the neckline.
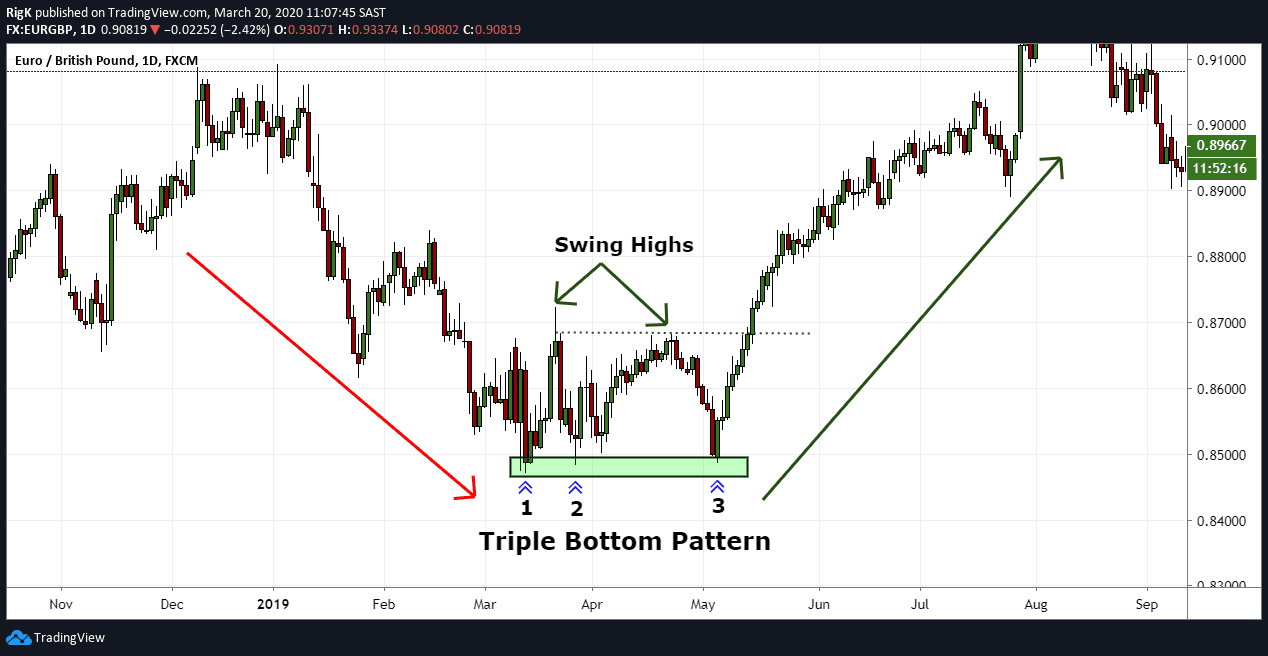
Triple Bottom Pattern
Useful Pages:
Compare Stock Brokers | Compare Forex Brokers | Compare CFD Brokers
The Triple Bottom is an extension of the Double Bottom pattern. Price patterns on a Triple Bottom show us multiple failed attempts to break through areas of support and resistance before a final breakthrough. Traders often wait to see if the price breaks above the final swing high to confirm that a triple bottom has been completed.
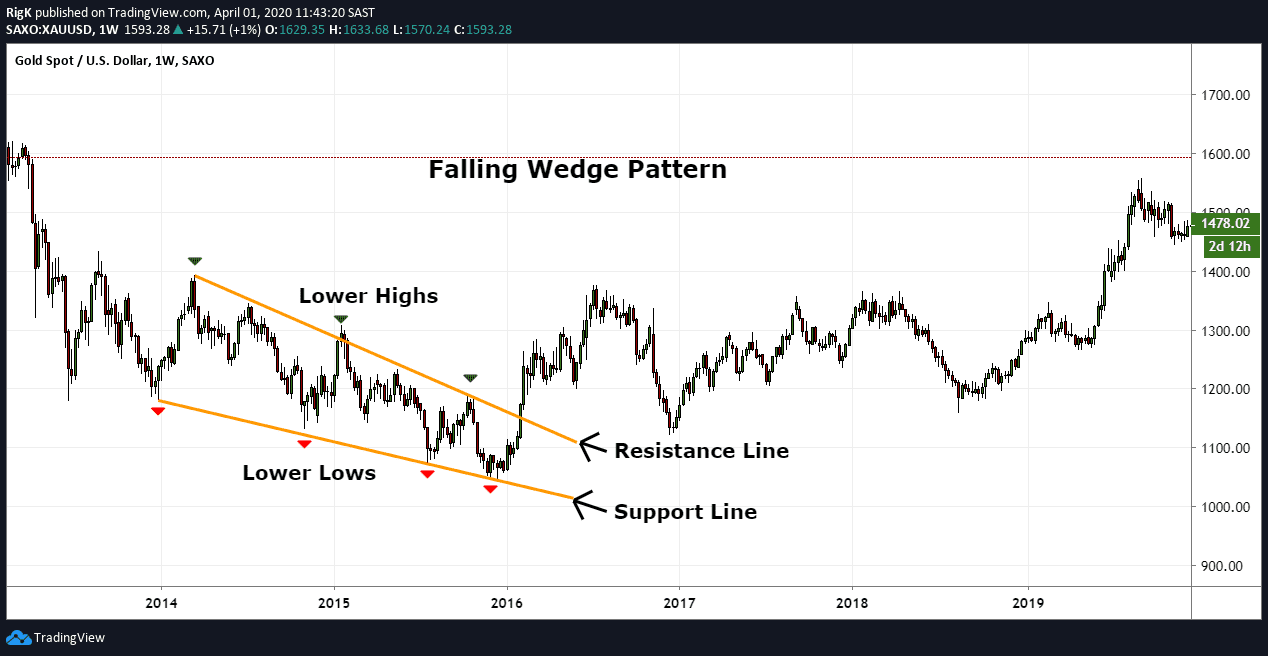
Falling Wedge Pattern
A Falling Wedge is a popular bullish reversal pattern formed by two parallel descending trend lines. These lines will gradually slope and contract before the price finally breaks through the resistance line on an upward trend. Because of their downward sloping trend lines, Falling Wedges are frequently confused as bearish continuation patterns.
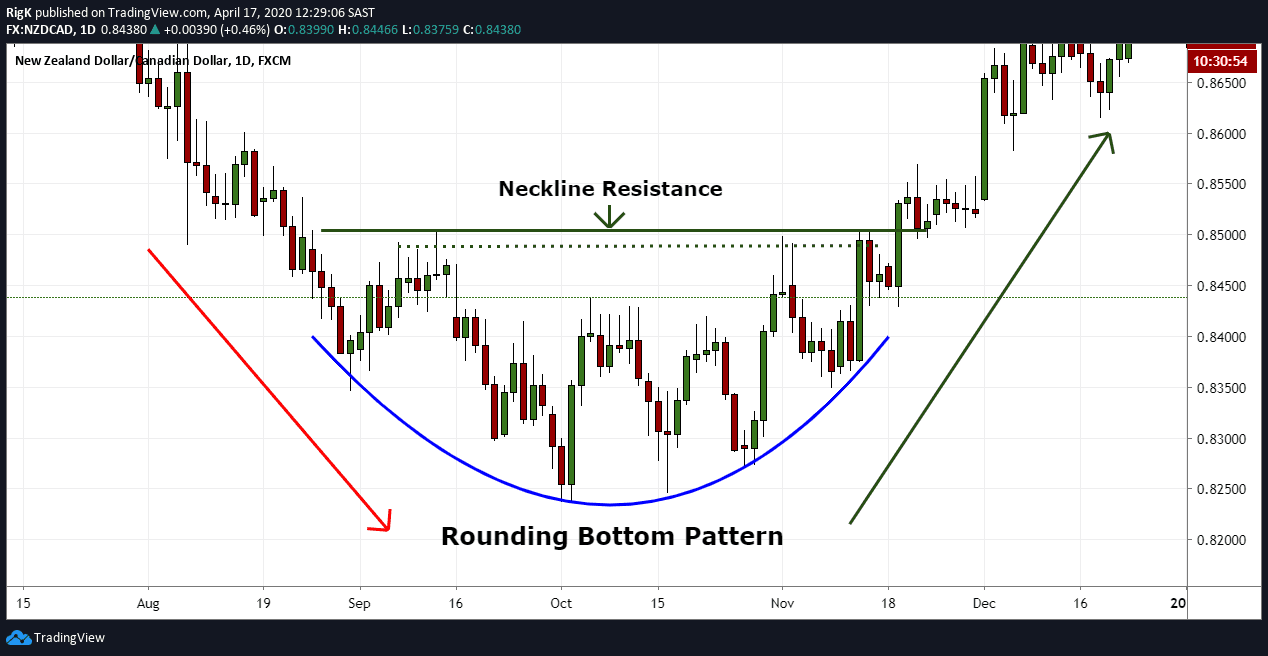
Rounding Bottom Pattern
Price movements in a Rounding Bottom pattern form an instantly recognisable ‘U’ shaped bottom. At the neckline resistance level, we can see that the price has had multiple stabs at breaking through before eventually breaking resistance. Once price finally breaks and closes above the neckline, this pattern is considered complete.
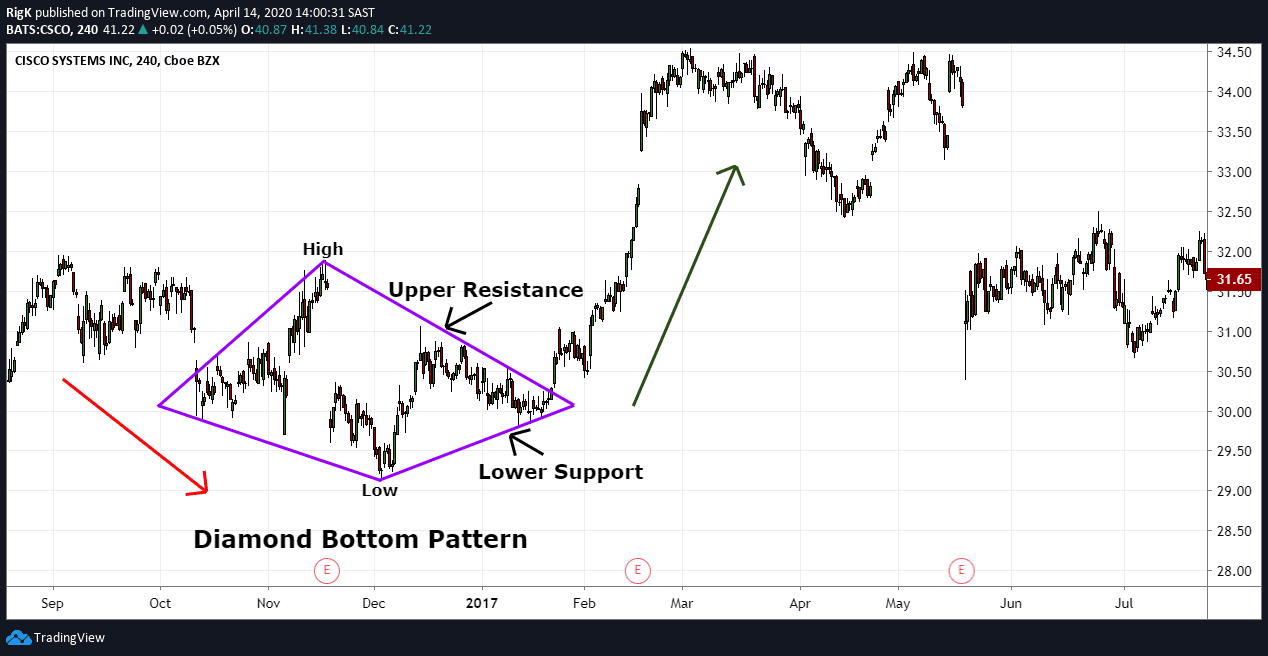
Diamond Bottom Pattern
Whilst not a common pattern, the Diamond Bottom is nevertheless considered a strong bullish reversal pattern. It expands from the left-hand side before contracting into a narrower range until the price breaks out above the resistance level.
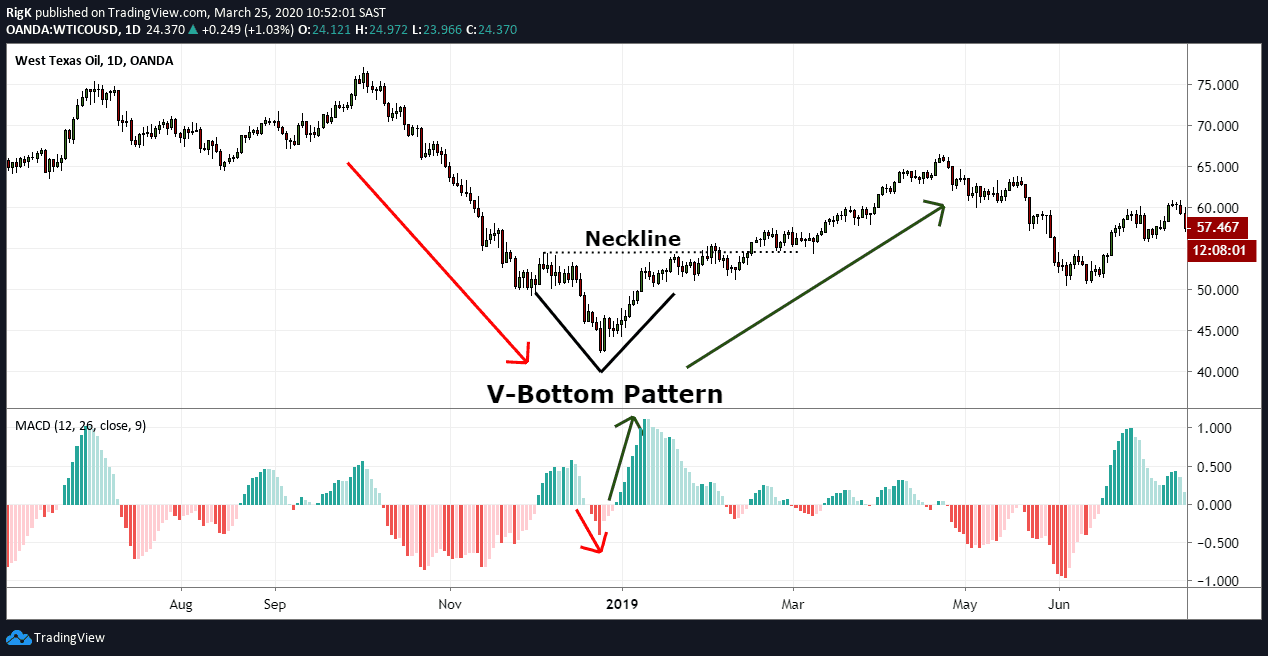
V Bottom Pattern
The V Bottom pattern derives its name from distinct ‘V’ shape formation that appears when price aggressively switches from a bearish selling state to bullish buying one.
Bearish Reversal Patterns
A bearish reversal pattern typically appears at the end of an uptrend and is characterised by lower peaks and lower troughs. Signaling a potential reversal and subsequent downtrend, bearish reversal patterns are an indication that selling pressure from bears is starting to influence the market. Traders holding long positions look to identify a downtrend as early as possible and will typically look for bearish confirmation signals. For some traders, a downtrend represents new trading opportunities as it allows them to trade both long and short.

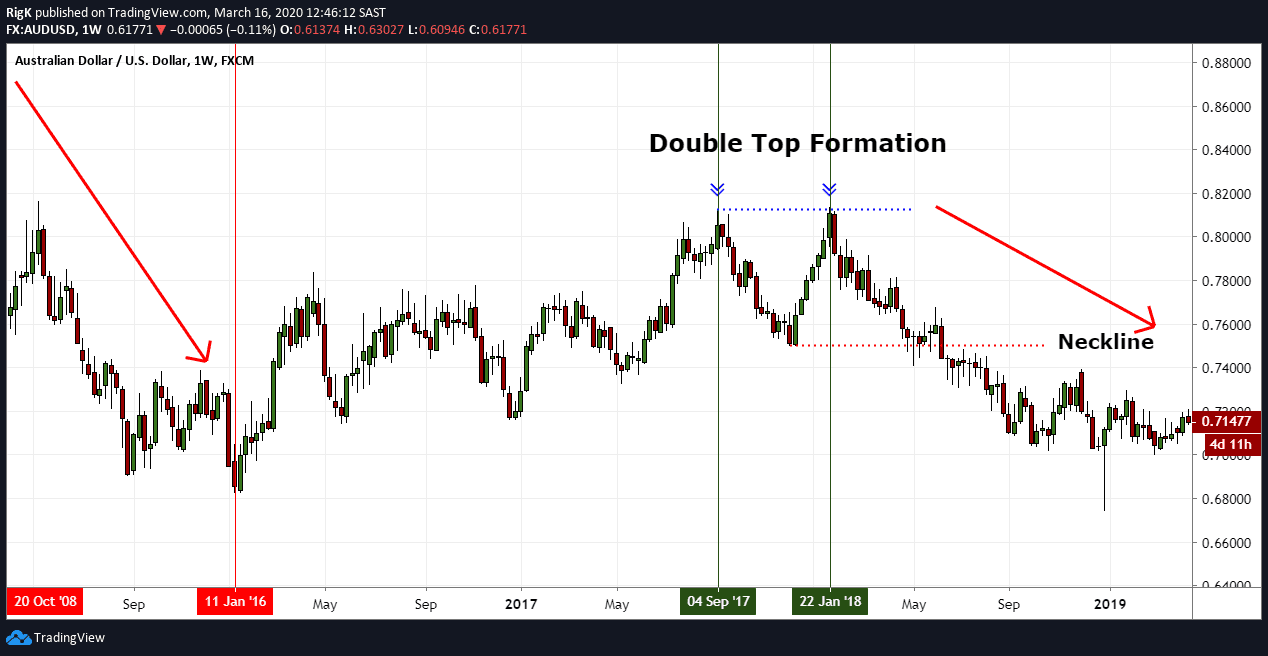
Double Top Pattern
A Double Top is a bearish pattern consists of two nearly equal ‘tops’ with a ‘valley’ between them that creates the neckline. It signals a bearish reversal in the market after a bullish upwards trend. Many traders will only consider a Double Top pattern to be complete once the price breaks and closes below the neckline.
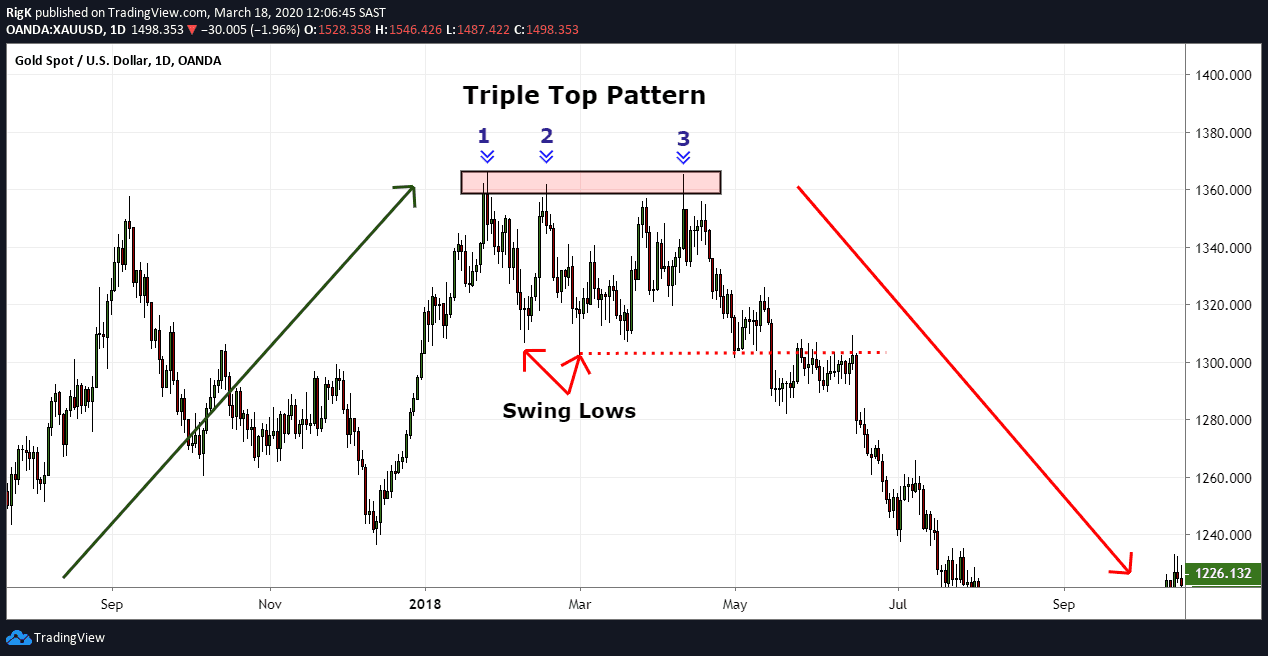
Triple Top Pattern
A Triple Top pattern – an extension of the Double Top – is a bearish reversal pattern that could be an indication that buyers (bulls) are losing control of an upwards trend and that sellers (bears) are taking over. Like the Triple Bottom, it shows traders multiple attempts to break support and resistance before a breakthrough that continues a downward trend.
Head and Shoulders Pattern
The Head and Shoulders pattern is a reversal chart pattern that indicates a prior chart trend is either reversing or has already reversed. It signals to traders that an upward trend is over and that the price is heading for a decline.
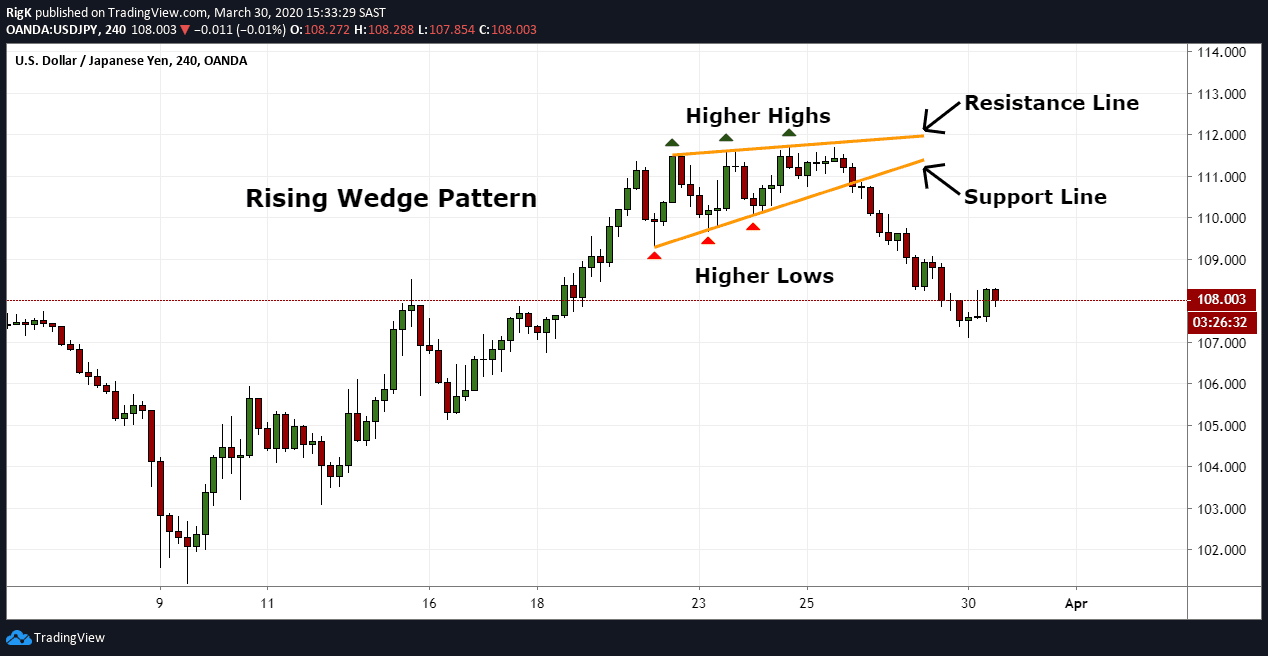
Rising Wedge Pattern
A very common formation, the Rising Wedge can appear in any market and timeframe. It is a strong bearish reversal pattern formed by two parallel ascending trend lines that gradually slope upward and contract. The price eventually breaks hrough the support line and a change in direction occurs.
Rounding Top Pattern
The Rounding Top pattern signals the potential reversal of an uptrend and consists of a rounded top (hence the name) and neckline support that shows where the price has failed to break through on several occasions. Eventually, the price does break through and the pattern is considered complete when it closes below the neckline.

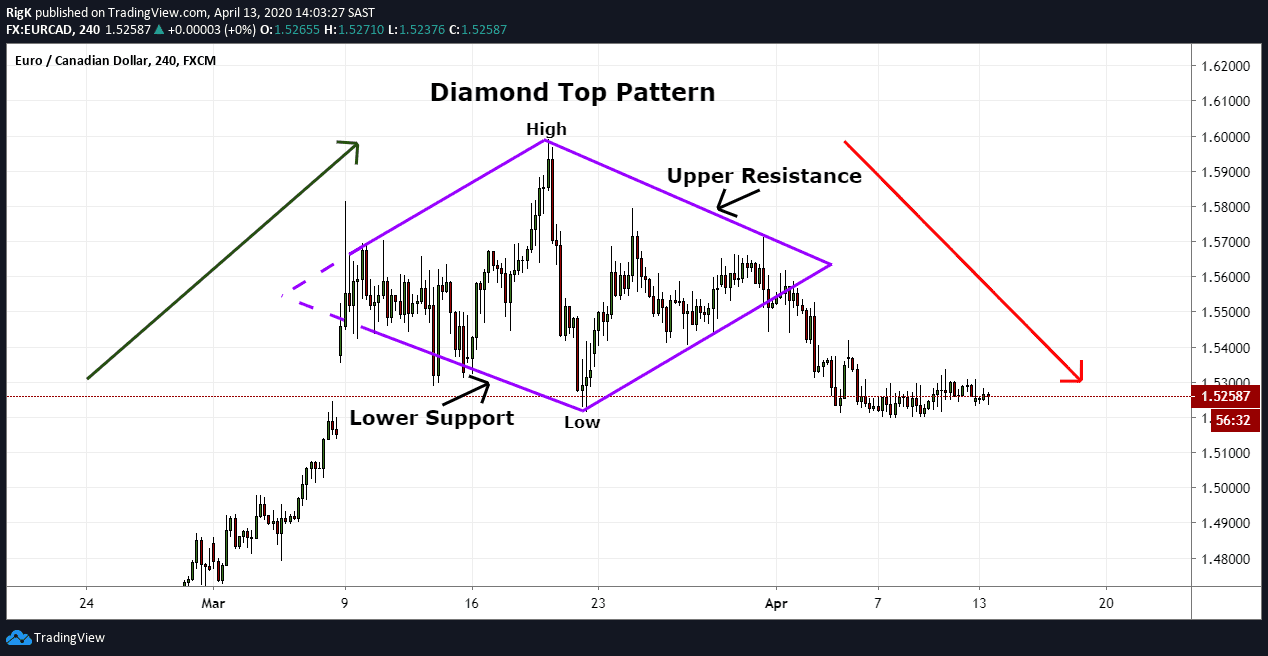
Diamond Top Pattern
In the same vein as the Diamond Bottom, the Diamond Top pattern is not a common formation. However, it is considered a strong bearish reversal pattern by analysts. In this pattern, price expands into a high before contracting into a narrower range and eventually breaking through the support line.
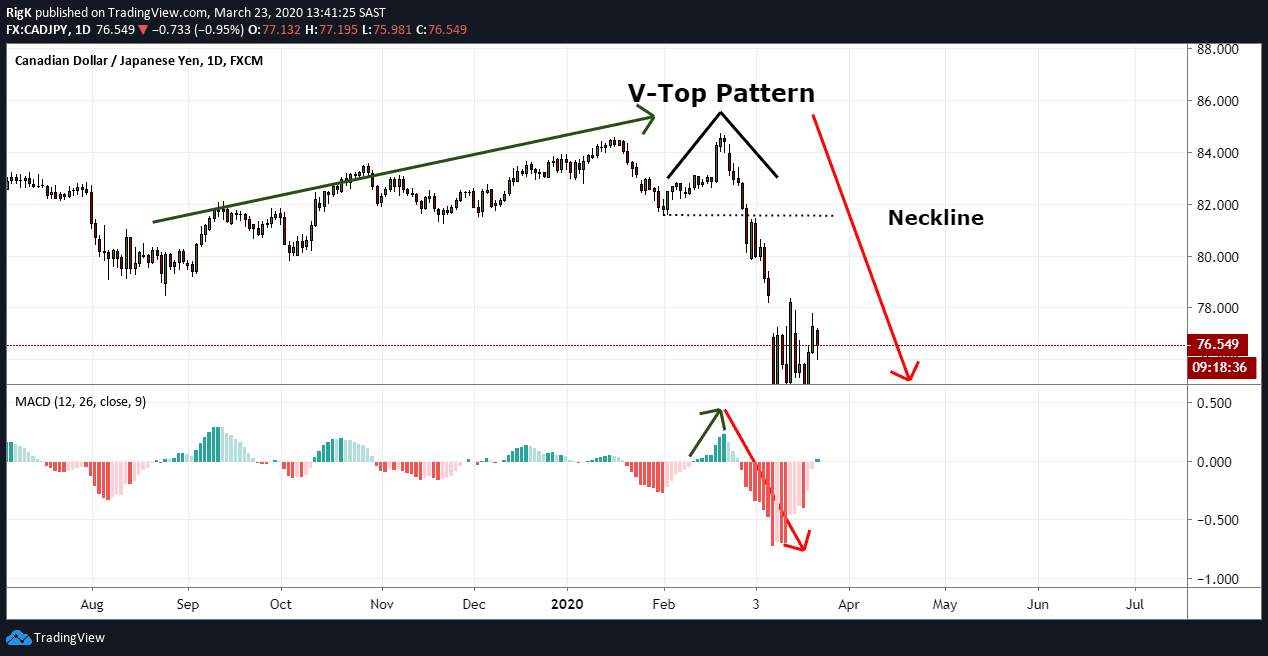
V Top Pattern
Like its counterpart, the V Bottom, the V Top pattern signals an aggressive price switch. In this case, the market has pivoted from a bullish buying state to a bearish selling one.
Continuation Patterns
A Continuation Pattern typically occurs in the middle of a trend and indicates that the current trend (bullish or bearish) is likely to continue. They signify a temporary period of consolidation after a big move shown in the form of sideways price movement that plays out over the short to medium term.
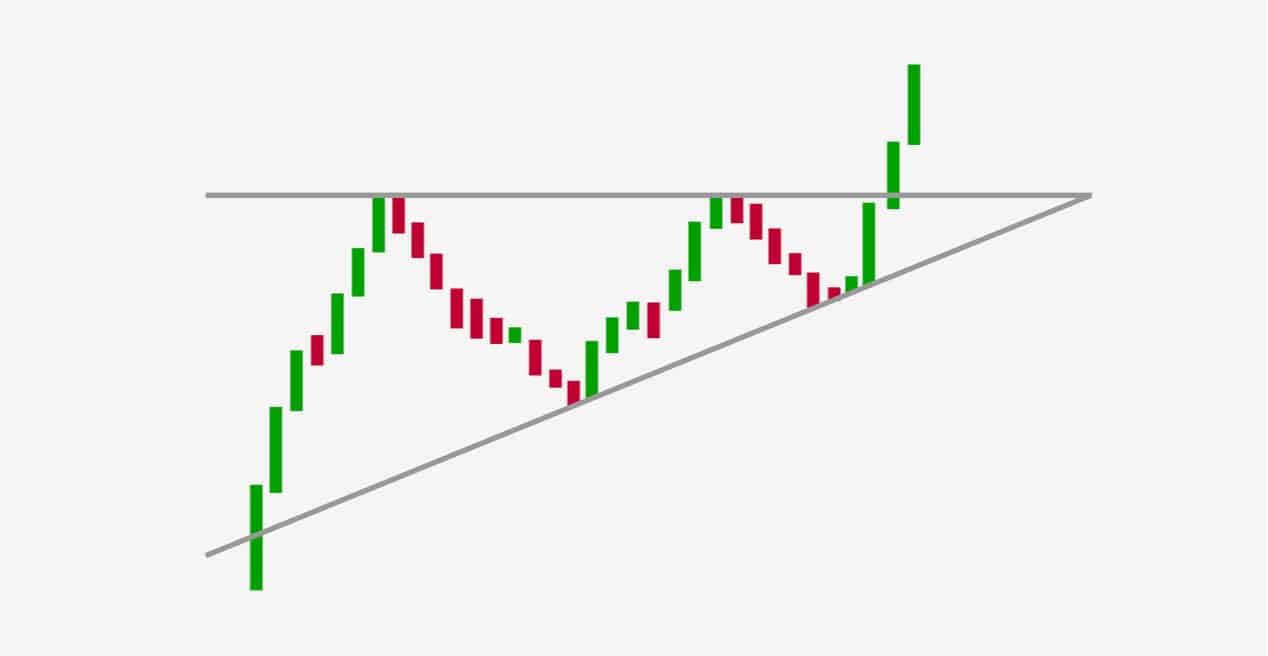
Triangle
While the Triangle chart pattern can be a reversal pattern too, it is most likely to indicate a continuation chart pattern that can be either bullish or bearish. The Triangle pattern forms when the price movement narrows down due to several price SWING converging together. This creates the appearance of a triangle.
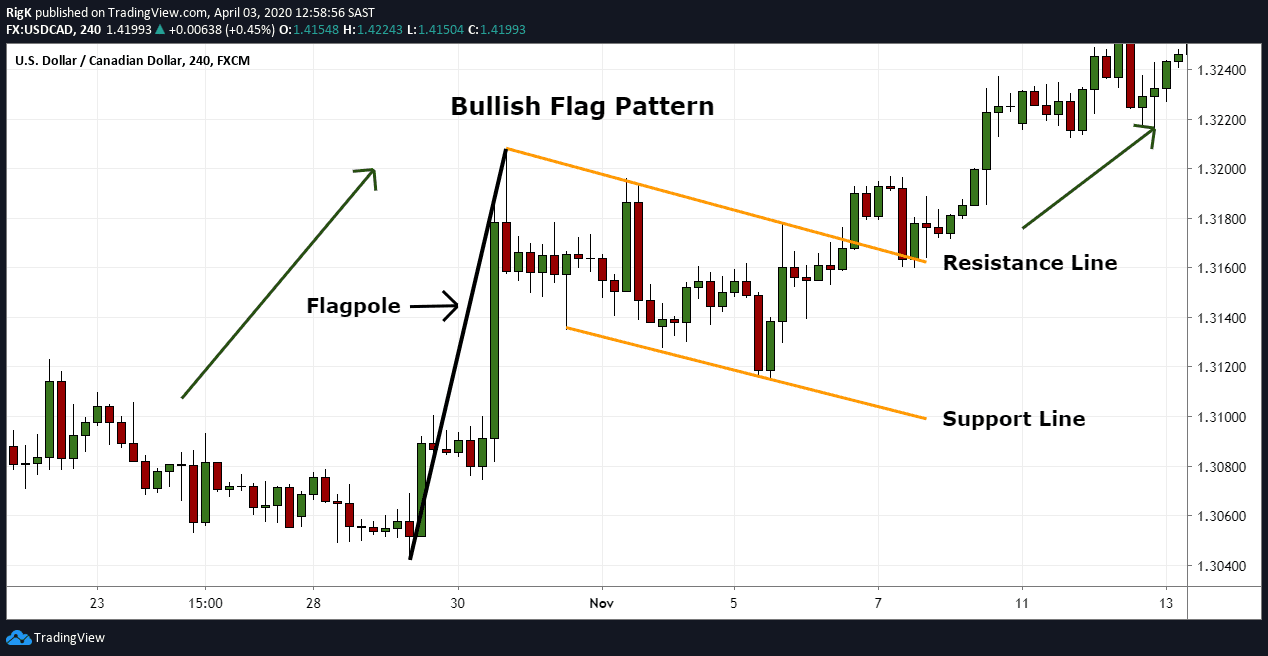
Flag and Pennant
Flags and Pennants indicate a continuation chart pattern. The terms flag and pennant are often used interchangeably. This pattern is formed when the price either advances or declines strongly and then moves sideways or downward slightly, then continues its strong advance or decline. Both flags and pennants can be either bullish or bearish.
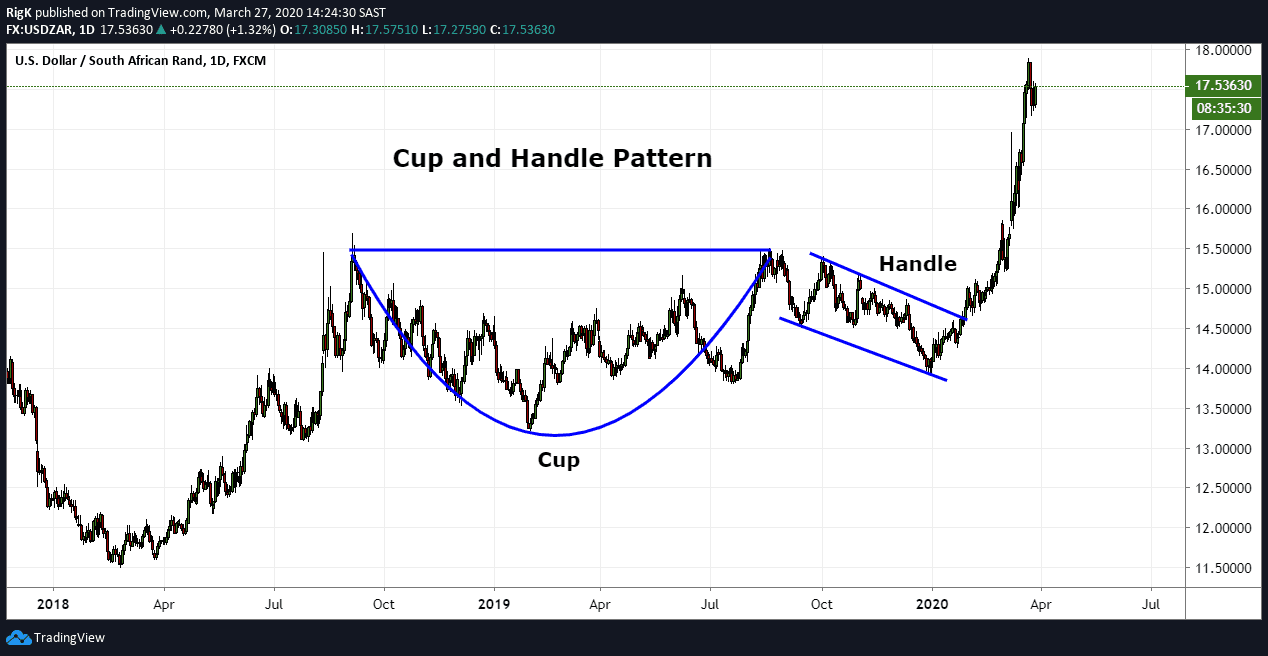
Cup and Handle
The Cup and Handle is a bullish continuation pattern that marks a consolidation period followed by a breakout. It consists of a ‘cup’ formed after a downtrend followed by an uptrend and a handle formed as a trading range develops. Together, they resemble a teacup. Occurring in all time frames, it signals a drop in price before a rise back up to the original value, followed a smaller drop (the handle) and eventual a rise past the previous high.
PEOPLE WHO READ THIS ALSO VIEWED: