Ready? Let’s get started.
What Is Momentum Trading?
Momentum trading is a financial market strategy approach that capitalises on big and fast moves in the underlying price of a security. Traders will look to buy securities when they are rising and sell them when they are falling.
When an asset reaches a higher price, it usually attracts more attention from traders and investors, which pushes the market price even higher. This continues until a large number of sellers enter the market.
Once they are enough sellers in the market, the momentum changes direction and will lower the asset’s price.
In essence, momentum is the speed at which market values are changing in an asset.
Momentum readings can be further classified into two distinct categories: Absolute Momentum and Relative Momentum.

Absolute Momentum
Market behaviour in an asset’s price is based on its relationship to past performances using historical time sequences.
Relative momentum
Market behaviours in individual securities prices are compared with one another (showing relative strength that differentiates between strong-performing assets and weak-performing securities).
Key Factors of Momentum Trading
Volume
Volume is the number of assets being traded in a particular time frame. Momentum traders need to enter and exit the trade quickly, so a steady stream of buyers and sellers in the markets is required.
Volatility
Volatility is a statistical measure of a market’s tendency or security to rise or fall sharply within a short period. It is essential for momentum traders to Momentum to find volatile markets to take advantage of short-term rises and falls in an asset’s value.
Time Frame
Momentum trading strategies rely heavily on short-term market movements such as day trading and scalping. However, the duration of the trade can depend on how long the trend maintains its strength. Besides short-term trading, momentum traders focus on longer-term styles, such as position trading.
How Is Momentum Calculated?
First, traders must understand what the word “momentum” actually means in practical terms. For these purposes, a straightforward definition of the concept can be interpreted as follows:
Momentum = Underlying Trend Strength
Let’s consider market price activity using three different examples:
Positive Momentum
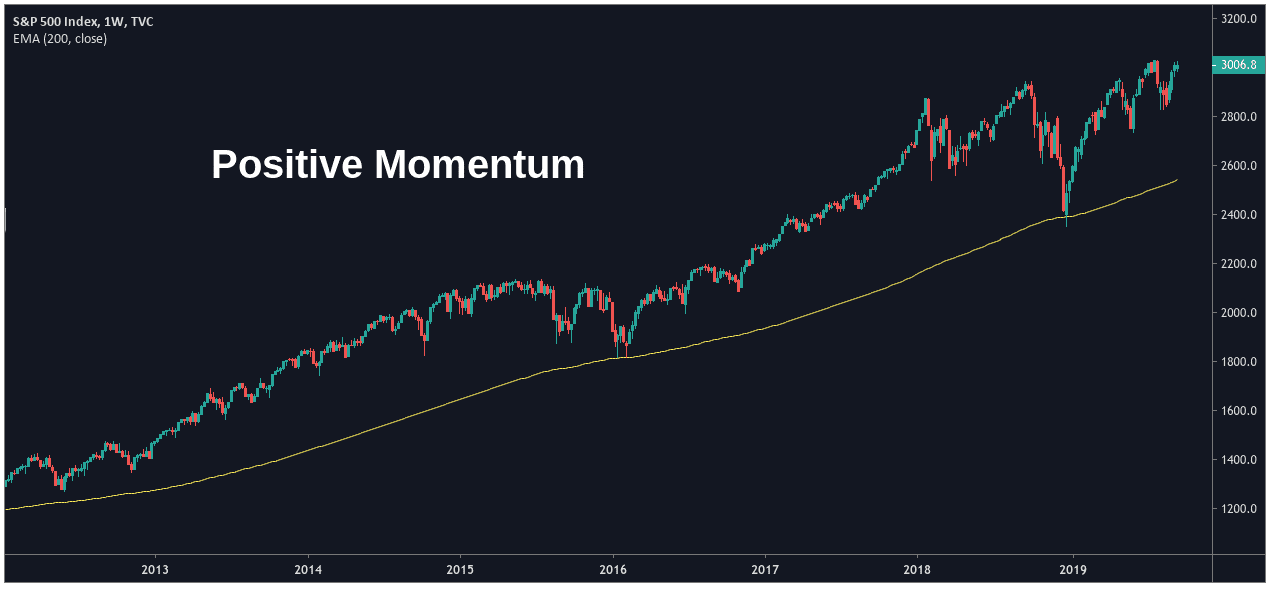
In our first example, we can see a market showing positive price momentum. In this case, the asset is consistently holding above its 200-period exponential moving average (EMA) while its trend continues moving higher.
Negative Momentum

In our second example, we can see a market showing negative momentum. In this case, the asset consistently holds below the 200-period EMA while it continues moving lower.
No Directional Momentum
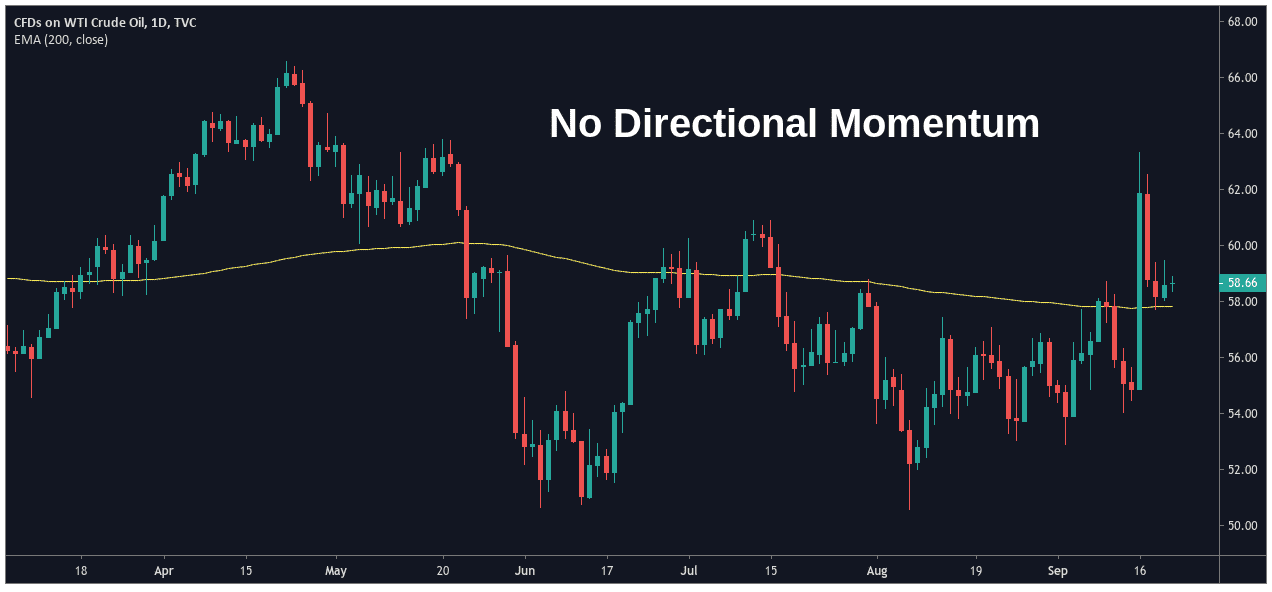
In our third example, we can see a market with no clear directional momentum. In this case, the asset price consistently oscillates above and below its 200-period EMA. Prices are trading erratically (while moving sideways), and there is no significant trend dictating the asset’s value.
Best Momentum Trading Indicators
Many technical indicators can be used to judge the momentum of an asset. Some of the best momentum indicators are:
- RSI
- Stochastic
- ADX
- CCI
- MACD
With these indicators in mind, let’s look at some of the strategies you can use for momentum trading.
Momentum Trading Strategies
Strategy 1: Determining the trend momentum of an asset with ADX
What is needed:
- ADX
- 200 period moving average
- Daily chart
The Average Directional Index (ADX) is a popular trading tool used to determine an asset’s trend momentum.
As the ADX level rises, it indicates a strengthening trend. In other words, the trend might be bullish, or it might be bearish — all we know is that the underlying trend is gaining strength.
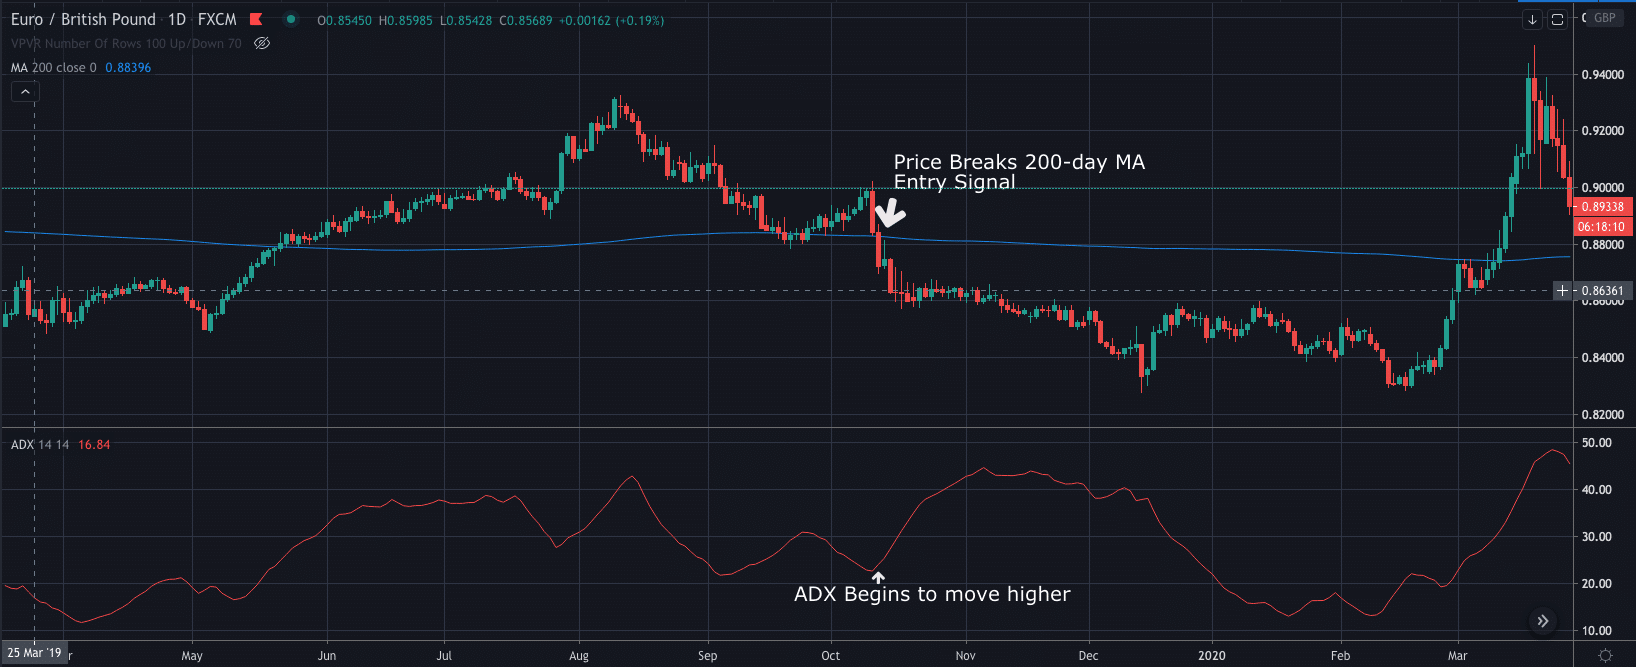
To the left of the price chart, we can see that the EURGBP price begins moving higher.
As the ADX value rises towards 100, we can see that the underlying trend is also strengthening.
In this example, the ADX strengthens as the EURGBP price moves above the 200-period moving average. This essentially gives us two independent pieces of evidence that suggests strength is building in the underlying price trend.
How to enter a position:
- Wait for the ADX to trend higher
- Wait until the price breaks the 200-day moving average
Once you have entered your long position, your stop-loss should be placed under the most recent swing in price, while your target is 2x that. Giving you a 2:1 profit ratio.
Strategy 2: Spotting divergences in price action
Another strategy traders can use to spot divergences in price action.
What you will need for this strategy is:
- RSI
- Four-hour chart
Divergence is when price trends in one direction, but the indicator (in this case, the RSI) starts to trend in the opposite direction.
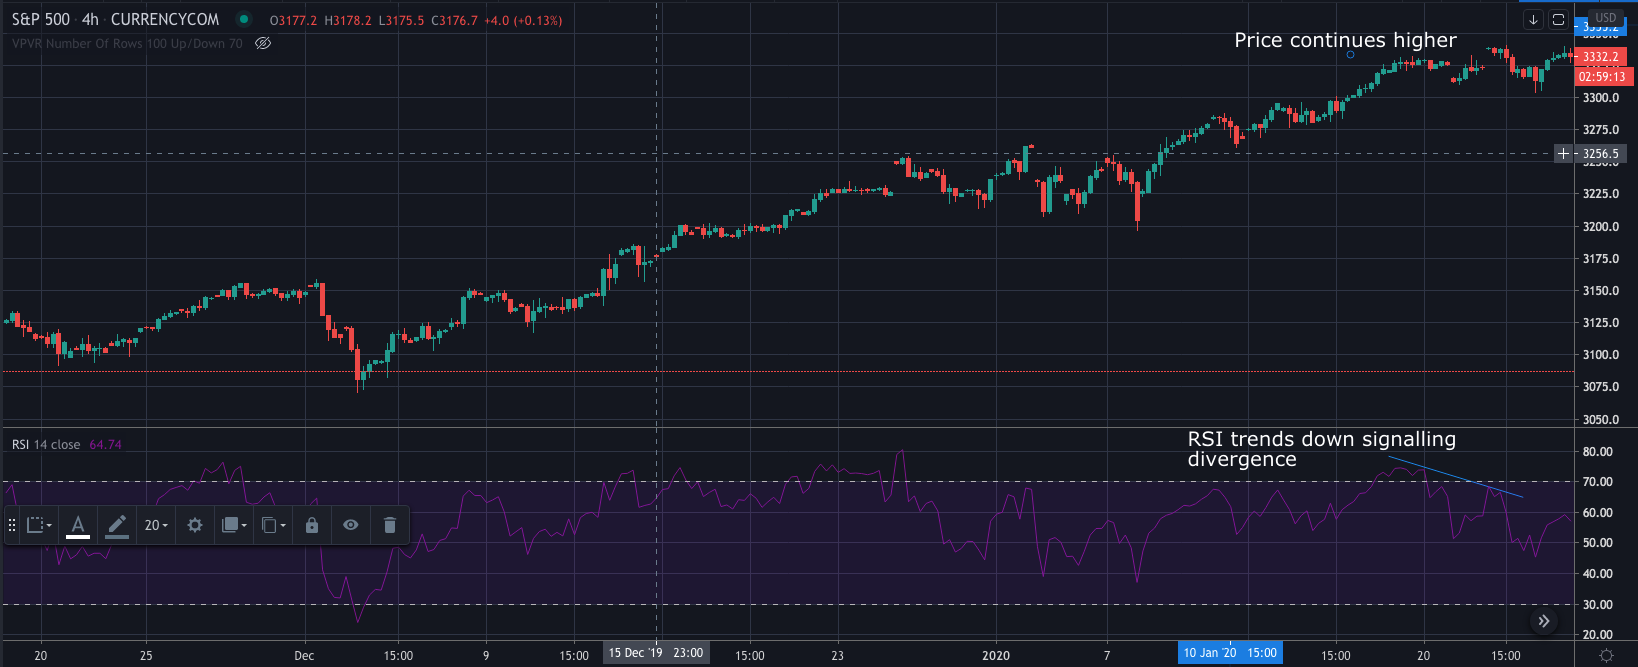
In the example shown above, we can see that the S&P 500 price is rallying to reach record highs. However, we can also see that the RSI indicator is making lower highs, signalling divergence.
So, to enter a position, we would look for:
- Price trending in one direction
- RSI Trends lower
- Enter in the direction of the RSI (in the above case, this would be a sell position)
Similar to the first strategy, the stop-loss would go above or below the recent swing in price, while the take-profit target will be the next key level, which is at least 2x our stop.
Some significant aspects of momentum trading can help you to make quick profits. However, there are also negative aspects, as well.
So let’s take a look at both sides:
Advantages of Momentum Trading:
- Big profits in a short period – fast moves as momentum builds.
- Great for day trading – As profits can be taken quickly, you can take short term trades (although it can also be used on longer timeframes as shown in the strategies above).
- Take advantage of the volatility – you can capitalise when markets surge in one direction.
Disadvantages of Momentum Trading:
- Can take up a lot of time – As moves are usually fast, you need to monitor your charts continually
- Potential for quick losses – With the potential for fast profits also comes the potential for immediate losses.
The Bottom Line
As you can see, the advantages outweigh the disadvantages when it comes to momentum trading.
While that is a good thing, it is still vital to backtest every strategy and understand the risks. It takes a lot of discipline to master risk management, as fast profits also mean the potential for fast losses, so you must reduce risks.
However, if used correctly, it can certainly result in impressive returns.
PEOPLE WHO READ THIS ALSO VIEWED:
- Here are our latest trending stories
- Trade with award winning broker Pepperstone
- Learn how to use bullish and bearish divergence