After a tumultuous nine months, stock investors are eagerly looking for signs that the worst of the 2022 stock market sell-off could be over. The temptation to try to pick the bottom of the market is a strong one, and the Q3 2022 earnings season is an ideal time to reassess which stocks might rebound.
YOUR CAPITAL IS AT RISK
There are also stocks to avoid – or you should at least wait for prices to fall further before buying them. This list of the Big Misses From Early Quarter 3 2022 Earnings Reports highlighting those companies whose own reports identify them as struggling to deal with the challenges facing the market.
Table of contents
What Is an Earnings Estimate?
Earnings estimates are predictions made by professional financial analysts on key metrics such as a firm’s earnings per share (EPS) and total earnings. Specialist agencies canvas the chosen analysts and collate their forecasts and then turn them into an aggregated single number. This pinpoints what the market is expecting in terms of the company’s performance over the previous quarter.
The analysts are industry experts working at banks, institutional investment companies or specialist research firms. They use technical and fundamental analysis to make their predictions and also incorporate ‘guidance’ offered by the reporting firms. The latter element is provided so that the firms in question can manage expectations, and if necessary, pre-warn investors of bad news.
If after all that research, there is a big difference between the official earnings data and the analyst forecast, dramatic share price moves can be expected. Firms that ‘miss’ can expect their share price to fall, especially as there is a historical bias towards analyst predictions being conservative – with more than 70% of stocks typically posting earnings ‘beats’.
The scale of a miss, and peer group comparisons, also come into play, but an earnings miss is typically seen as bad news in terms of a firm’s prospects. For investors, the question is whether a bad earnings report represents the final shakedown and a chance to buy in at an even lower price, or confirmation that a stock is one to avoid.
Q3 Earnings Report Misses – Tesla (TSLA)
Elon Musk’s electric vehicle manufacturer Tesla (TSLA) releases one of the most eagerly awaited earnings reports of the entire season. The high profile of the maverick CEO and the ground-breaking approach of the auto manufacturer make the firm a household name and commonly held stock.
Tesla’s earnings results lift the subject of quarterly reporting out of the financial press and onto mainstream channels – which partly explains why the company’s earnings miss of 19th October was followed by a 1.83% fall in the value of NASDAQ 100 futures in the space of six hours.
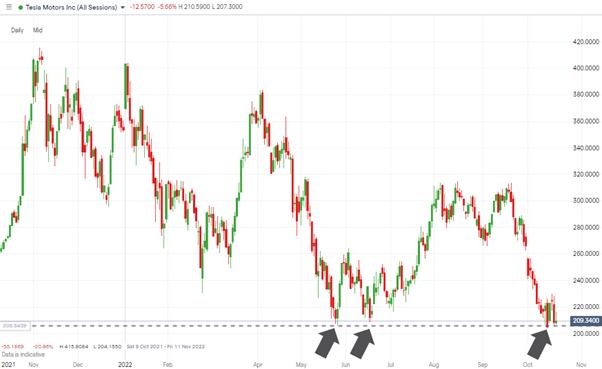
For Tesla stock itself, the disappointing results led to an almost 10% price crash in out-of-hours trading. It also left analysts poring over the report to establish whether this is the end of the stock’s multi-year bull run, or a chance to buy a dip.
Tesla Misses on Key Metrics
Not all the Tesla Q3 2022 earnings news was bad. The EPS number beat analyst expectations, coming in at $1.05 versus the consensus estimate of $0.99. Net Income (GAAP) reached $3.3bn, which was double the figure posted one year earlier.
It was the total revenue of $21.45 that spooked investors. This number failed to match the forecast $21.96, and the guidance offered by Musk and his team on the investor call left many shareholders heading for the exit.
Speaking after the release, Musk was upbeat about Tesla prospects, but concerns about inflation and a possible recession has left many wondering how much of the extra costs can be passed onto consumers before demand falters. The operating profit margin of 27.9% was the same as in the Q2 2022 report, but many see future demand for Tesla EVs being on a cliff edge.
On the investor call, Musk said: “I can’t emphasize enough we have excellent demand for Q4, and we expect to sell every car that we make for as far into the future as we can see. The factories are running at full speed and we’re delivering every car we make and keeping operating margins strong.”
However, the share price reflects that many aren’t as convinced that supply-side issues and point-of-sale price rises won’t drag down future revenues – which adds up to the P/E ratio of 123.4 looking sky-high.
| Growth, Valuation, Trading | Information |
| Market cap | USD 642.33B |
| EPS recent fiscal year | USD 1.63 |
| Profit margin | 14.22% |
| Return on investment | 14.569% |
| Normalised P/E ratio | 123.479 |
Source: IG
Those considering buying the dip will be paying close attention to the $205.83 price level. In May and June 2022, this marked the point at which TSLA stock bounced. As long as this price level holds, there is a chance that the current sell-off forms part of a bullish triple-bottom pattern.
Q3 Earnings Report Misses – Morgan Stanley (MS)
Morgan Stanley’s Q3 2022 earnings misses on EPS and total revenue were relatively small in scale, but do ring alarm bells for anyone holding or considering buying MS stock. After the report was released on Friday 14th October, the share price plummeted to end the session 4.75% lower than at Thursday’s close.
The miss represents the second consecutive quarter that Morgan Stanley has produced numbers lower than analysts expected – a situation made worse by the fact that in 16 of the previous 20 earnings statements, the firm has posted beats. Whatever its long-term prospects, Morgan Stanley is currently on a bad run.
Peer-group comparisons are also unfavourable. Arch-rival JP Morgan released earnings figures on Thursday 13th October that beat analyst forecasts and moved JPM stock into the group of Q3 2022 earnings winners to consider buying.
Morgan Stanley Misses on Top and Bottom Numbers – Share Price Dips, Then Rallies
The immediate sell-off in MS stock on Friday 14th October was followed by a rally during the first trading sessions of the following week. This reflected market-wide enthusiasm, rather than MS being a particularly attractive proposition.
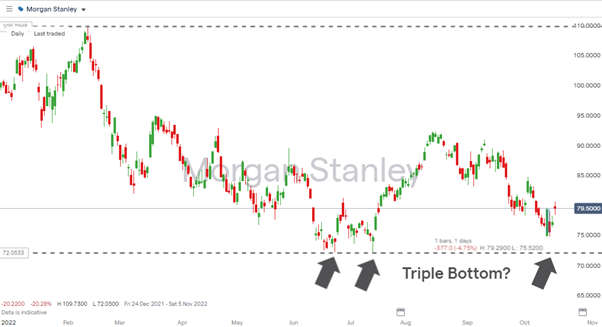
The short-term price surge also mirrors the immediate reaction to the Q2 earnings miss. Price then bounced off the $72 price support level, and at one point in August reached as high as $92.29. However, that rally ultimately represented a false dawn.
Price is currently trading back below $80, and unfortunately for Morgan Stanley shareholders, the earnings report explains why. Actual EPS of $1.47 missed the analyst estimate of $1.49, and total revenue of $13.0bn was lower than the $13.3bn forecast.
2022 has been a bad year for the divisions of investment banks that manage IPOs and M&A activity. In line with the trend, investment banking revenue at Morgan Stanley was 55% lower on a year-on-year basis – and possibly most concerning for investors, there are currently few signs that 2023 will be any different.
The sluggish MS share price performance suggests that some of the bad news is priced in. The dividend yield of 4.11% compares well to its main rivals, but the profit margin of 20.6% is some way off the 30.07% recorded by JP Morgan.
MS registered a normalised P/E ratio of 9.03. However, JP Morgan posted a Q3 earnings beat and has a lower P/E ratio of 7.18, making it an all-round more attractive proposition – which all adds up to any potential buyers of Morgan Stanley being likely to wait for the price to fall further before taking action.
| Growth, Valuation, Trading | Information |
| Market cap | USD 129.28B |
| EPS recent fiscal year | USD 8.03 |
| Dividend yield | 4.117% |
| Profit margin | 20.663% |
| Return on investment | 2.924% |
| Normalised P/E ratio | 9.03 |
Source: IG
MS stock is now trading back close to the $72 per share price support level, which marks the year-to-date low. While that holds, there is as with Tesla an opportunity for the stock to form a triple-bottom price pattern. That would be a bullish indicator, and the ongoing stock buyback program ($2.6bn in Q3) also suggests that potential downside could be capped at that level.
Q3 Earnings Report Misses – Hasbro (HAS)
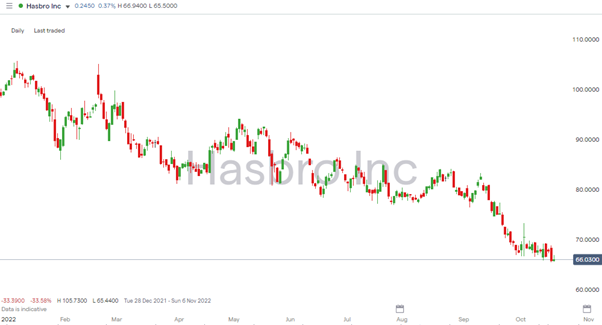
Toymaker Hasbro (HAS) reported disappointing earnings on Tuesday 18th October and joins a group of firms under threat from the various macroeconomic challenges of 2022. HAS stock was down 3.6% on the day and is now 35% lower in value than at the start of the year.
The full earnings report detailed how inflation is eroding consumer buying power, and with price manufacturing costs set to continue into 2023, the outlook for Hasbro is turning gloomier.
The company also referenced the demise of Toys “R” Us as a reason why its products didn’t fall into consumer shopping baskets. The removal of that key outlet for Hasbro toys has created a vacuum in the market – one that could be filled by firms such as Target Corp (TGT) that might not necessarily have a strong desire to stock Hasbro items.
Inventories and Inflation Drag Down Hasbro Revenues
The scale of the earnings miss can be partly attributed to Hasbro declining to offer analysts guidance on how the firm had been performing. Left to take their shot, analysts overestimated on both the top and bottom lines.
EPS forecasts of $2.23 were considerably above the officially reported $1.93, and total revenues of $1.570bn also missed the analyst estimate of $1.70bn.
In its official statement, Hasbro disclosed that some inventory had been written off after Toys “R” Us filed for bankruptcy. Other excess inventory had been sold to discounters offering smaller margins on the sale. With toys being sensitive to trends and the risk of falling out of fashion, holding a fire sale may have been the best option to take, but it certainly ate into the bottom line.
Profit margins are currently 8.37%, which doesn’t leave much wriggle room when things go wrong. In addition, the intense pressure on consumers was referenced by CEO Chris Cocks, who said that the company is seeing “average consumer becoming increasingly price sensitive as the year has progressed”.
The P/E ratio of 15.12 is below the average for the S&P 500 index, but by no means looks cheap considering the challenges facing the firm.
| Growth, Valuation, Trading | Information |
| Market cap | USD 9.20B |
| EPS recent fiscal year | USD 3.38 |
| Dividend yield | 4.204% |
| Profit margin | 8.374% |
| Return on investment | 5.982% |
| Normalised P/E ratio | 15.126 |
Source: IG
Hasbro stock has potential to show further weakness, which means that there could be opportunities to buy into firm the firm at attractively low levels. A collaboration with a blockbuster movie franchise could act as a catalyst for a rebound, but until that and other valuation factors align, Hasbro is a stock to avoid.
Statistics on Earnings Report Misses
The number of firms in the S&P 500 index that beat analyst EPS forecasts is on a five-year average of 77%. This historical bias results in firms that report misses coming under greater scrutiny.
It is also important to factor in the scale of any miss and add some historical context. Morgan Stanley’s Q3 2022 miss was marginal, whereas Hasbro’s was on a far larger scale. However, the Morgan Stanley miss was the second in a row, which would raise a red flag for any investor whose analysis covers a wider timeframe.
The reasons why so many analyst forecasts are beaten are harder to pinpoint. It could be down to analysts wanting to protect their professional reputation and err on the side of caution. Firms also benefit from being able to post a ‘beat’, even if the target is set artificially low, and this can result in their guidance downplaying their prospects.
What Determines Stock Price Reaction to Earnings Misses?
For the second consecutive quarter, Morgan Stanley dipped and then rallied after posting an earnings miss. This partly counterintuitive move reflects that share prices of firms that post disappointing results can be buoyed by a general air of euphoria sweeping across the markets. When more than 70% of the data pool are posting wins, dormant investors can be stirred into buying back into the market.
The profile of a stock’s shareholder base can also influence the extent that share prices react to earnings news. Stocks such as Apple Inc (AAPL), which have a large percentage of their total float owned by passive funds and retail investors, tend to experience lower price volatility if earnings miss.
Passive funds own 20% of Apple and retail investors 41%. These shareholders tend to take a buy-and-hold approach and are less likely to be influenced by one quarter of surprisingly good or bad results. In comparison, stocks held by more active fund managers and day traders tend to fall or rise by a greater extent.
Historical data points to the S&P 500 stocks with the ‘stickiest’ investors rising by only 0.5% on earnings beats, whereas the average for the index is 0.7%. When earnings miss, the downside move is also more measured, with the average price fall for the index being 2.3%, but sticky stocks only falling by 1.4%.
If you’re wondering why good or bad earnings news doesn’t necessarily correspond to dramatic price moves, then consider whether the firms you’re following have a large percentage of sticky investors. Some that top this particular chart include Johnson & Johnson (passive 24%, retail 30%), Amazon (passive 17%, retail 40%), Ford (passive 22%, retail 47%), and ExxonMobil (passive 24%, retail 43%).
Final Thoughts
A positive earnings season can be a trigger for market rallies, but there are always losers as well as winners. The demanding macro situation of 2022 adds another layer of complexity and means that speculative buys of underperforming firms may take some time to come good.
A dip in price by a firm that posts a miss can be a buying opportunity, but some caution is needed. A clear indication that the company’s management team has identified how to improve performance could be a catalyst for a share price rebound, but firms dealing with systemic issues are best avoided.
Given the economic headwinds facing all firms, those posting Q3 2022 earnings misses don’t appear obvious targets at current price levels. Some further deterioration in price as the bad news seeps in could result in that question being asked again, but there are other firms managing to post earnings beats that deserve greater attention.
Whether you are an experienced investor or are new to trading, the recalibration process associated with earnings season can make it a good time to step into the market. There is additional ‘churn’ in the markets and this can result in new buying opportunities. If you are considering putting some cash into stock positions, then these trusted brokers offer the economic calendars and research on upcoming announcements that help tip the odds in your favour.
People Who Read This Also Viewed:
- Top Trading Strategies to Help Improve Your Returns
- The Best Starter Stocks for Beginners
- The Best Momentum Stocks to Buy Now
- Insider Report – What Do Big Investment Firms Do When Markets Sell Off?
- The Best Growth Stocks for 2022
- Is Now the Time to Diversify My Portfolio?
- Learn Stock Scalping Trading Strategies
- The Five Best ETFs to Buy During a Recession

