In its most traditional applications, values below 30 are interpreted as undervalued (or “oversold”) while RSI values above 70 are considered overvalued (or “overbought”). These informative readings can be used to design trading strategies and alert traders to potential price reversals or corrective pullbacks within a larger market trend.
Basics of RSI
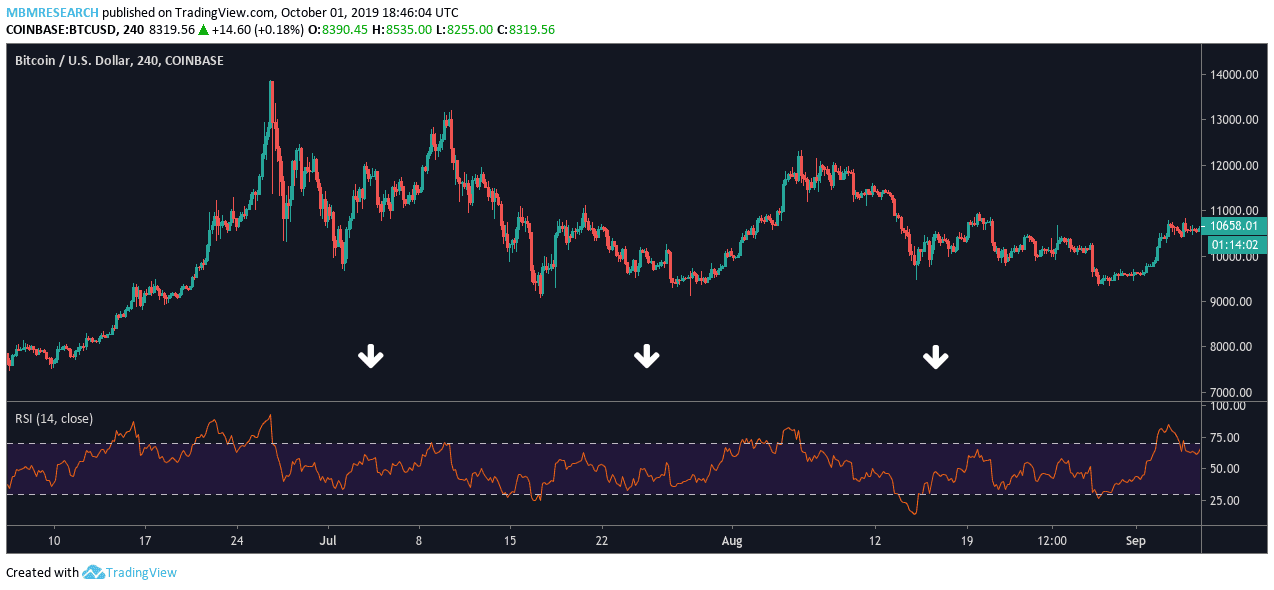
RSI is one of the market’s most popular technical analysis tools but it’s commonly misunderstood in its application. The underlying RSI calculations are fairly simple and based on a two-part formula:
Relative Strength Index =
100 – [ 100 / 1 + (Average Gain / Average Loss) ]
The calculation’s “average gain / average loss” figure is essentially the average price change (expressed as a percentage) spanning a specific look-back time period. Most charting stations set this default period as 14 days, and the second step in the indicator formula is to smooth the results over this period.
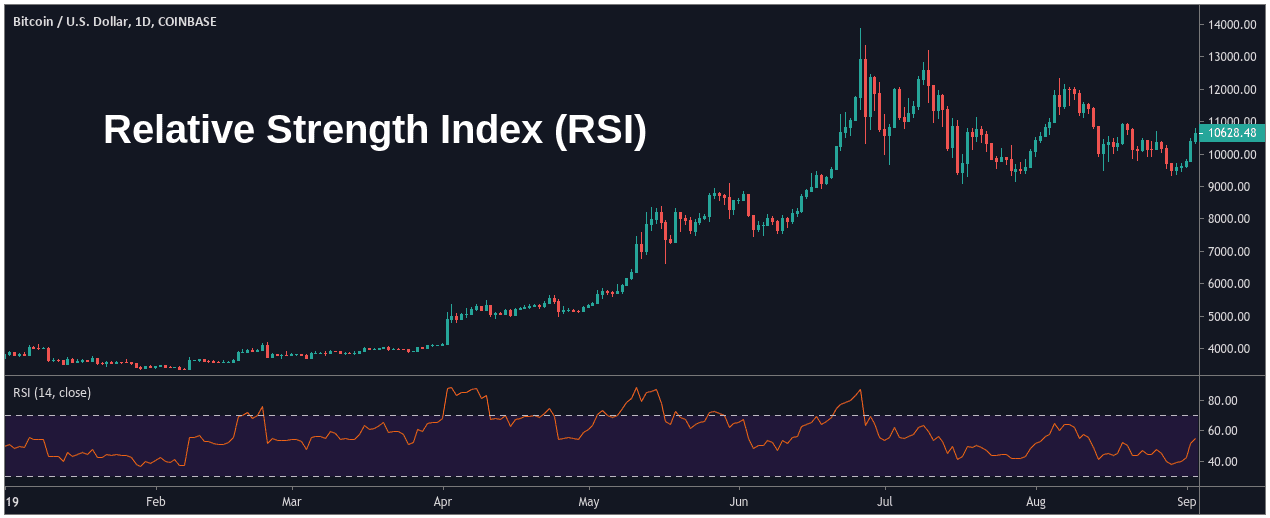
Using the calculations above, the value of the RSI can be below the price of an asset on its chart history:
Notice that the RSI rises as the number of bullish closing periods (green candles) increases, and fall as the number of bearish closing periods (red candles) increases. During strong uptrends, the value of the RSI will begin to approach 100. During strong downtrends, the value of the RSI will begin to approach 0.
Here is a larger view of the price chart above, showing RSI values in isolation:
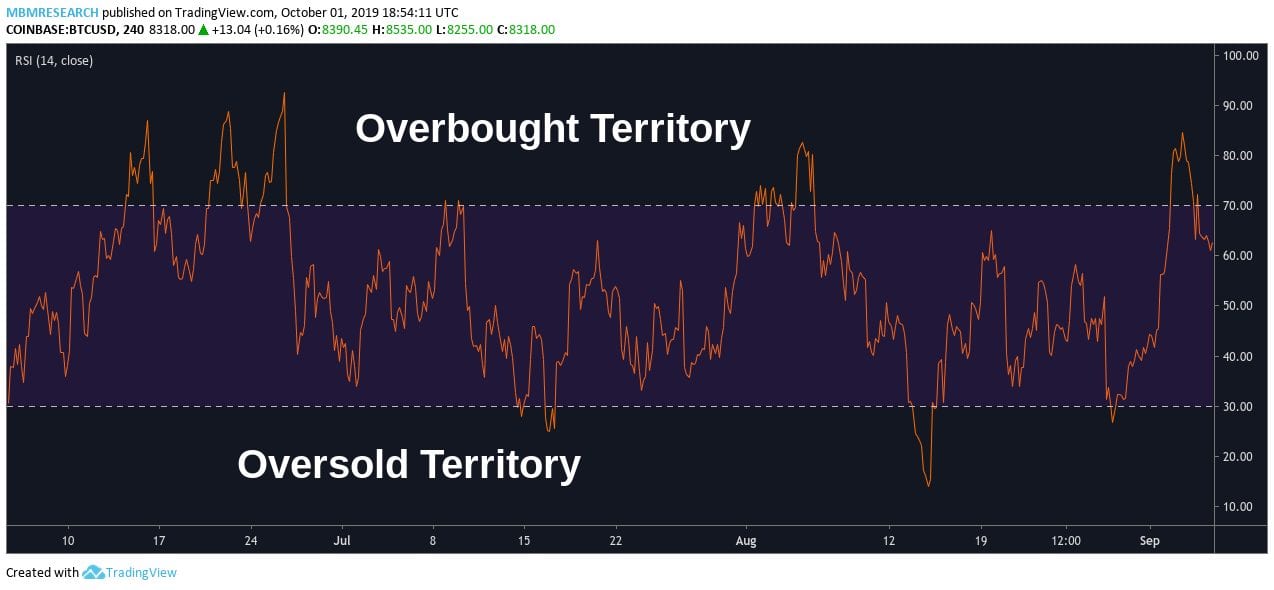
As we can see, RSI readings tend to hold within the mid-range for a majority of the price history. During situations where the RSI value extends beyond the median boundaries, the indicator is giving traders a signal which suggests a trend has become over-extended and that a reversal might be ready to begin.
RSI Trading Example
Let’s take a look at an example of how these signals appear on real-time price charts. In the early part of the BTC/USD price history (left side of the chart), we can see that BTC valuations are caught in a short-term rally:
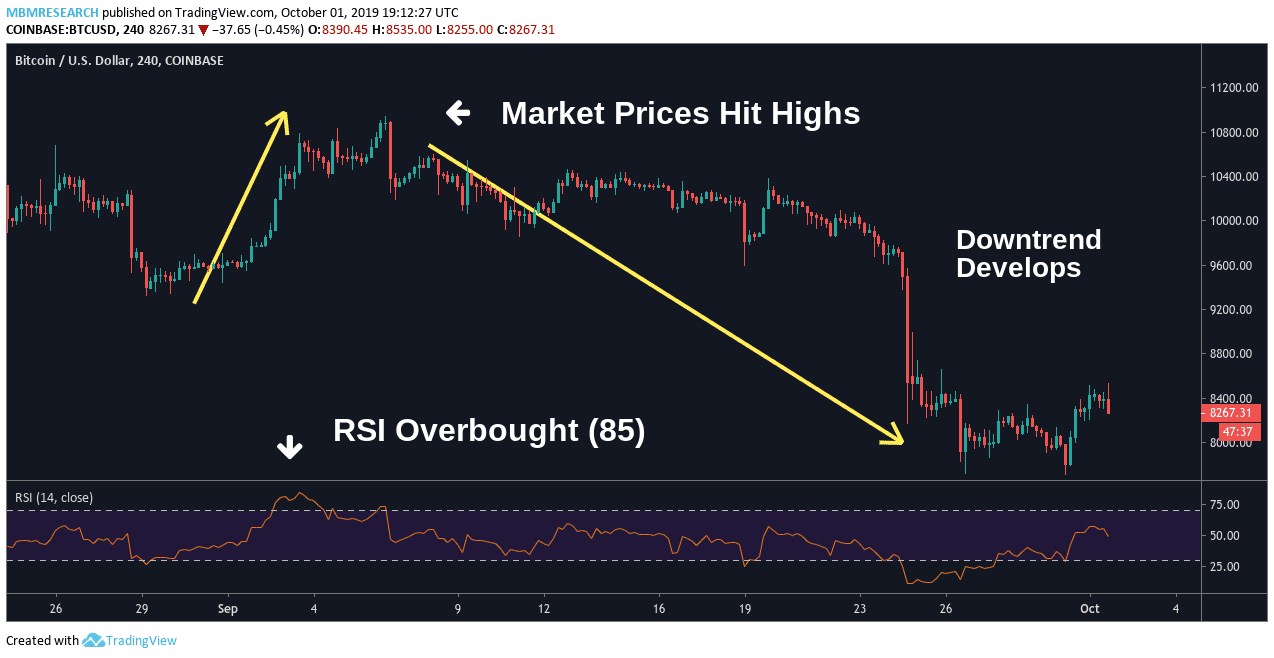
However, this bullish price activity sends BTC valuations into overbought territory (with the RSI reading moving to 85). The rally in BTC begins to stall once the indicator suggests the asset has become overvalued. In this example, our BTC/USD price chart is sending an important signal suggesting that it might be a good time to begin shorting the market.
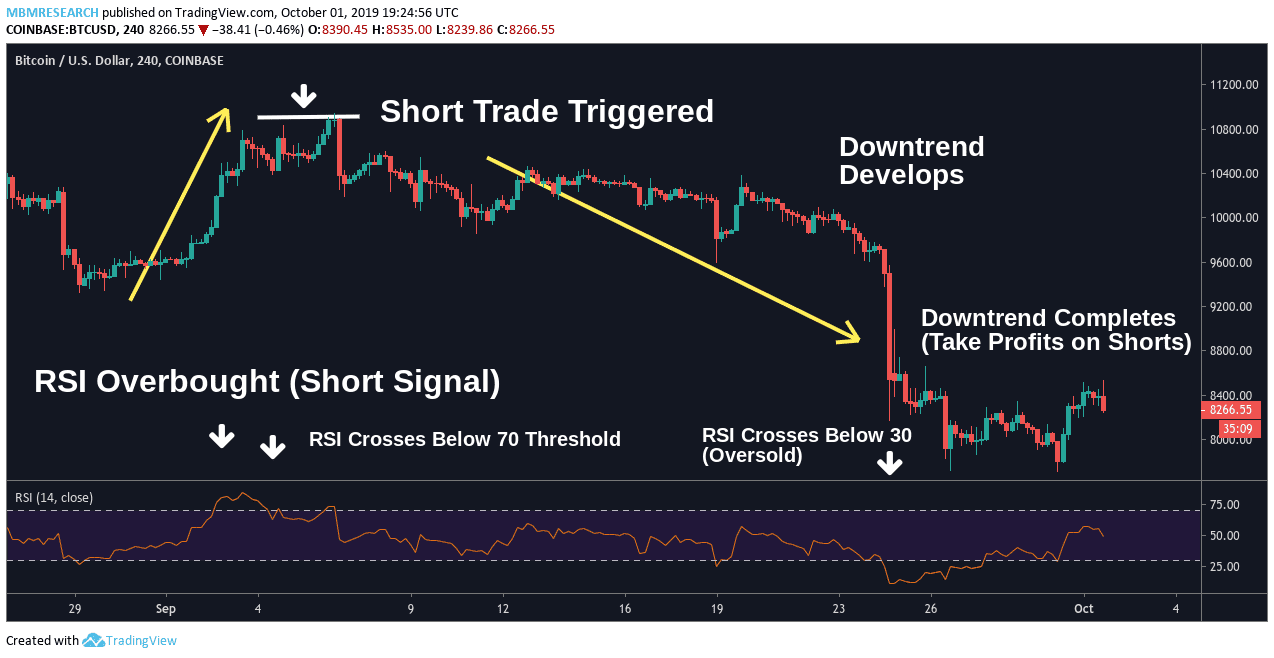
Confirmation of the original “overbought” signal comes when the RSI indicator crosses back below its 70 threshold. This RSI indicator activity confirms that market momentum is rolling over (i.e. the prior bull rally cannot extend any further).
At this stage, short trades should be initiated with a stop loss above the price highs which created the overbought indicator reading on the RSI (white horizontal line). Traders will place the stop loss in this area because the sell-signal will become invalid if prices are able to move above this area in the future. Profit targets on the short position should be placed at a distance that is at least 3x the total risk on the trade (the distance between the position entry point and the stop loss).
Once the BTC/USD short trade begins to move in a favorable direction (downward), traders can move stop losses to the break-even point (removing all risk on the trade). Traders must also begin to look for reasons to close the position in its entirety (capturing profits). This occurs as prices fall into oversold territory (breaching the 30 threshold to the downside), creating the signal needed to close the short position and collect profits on the trade.
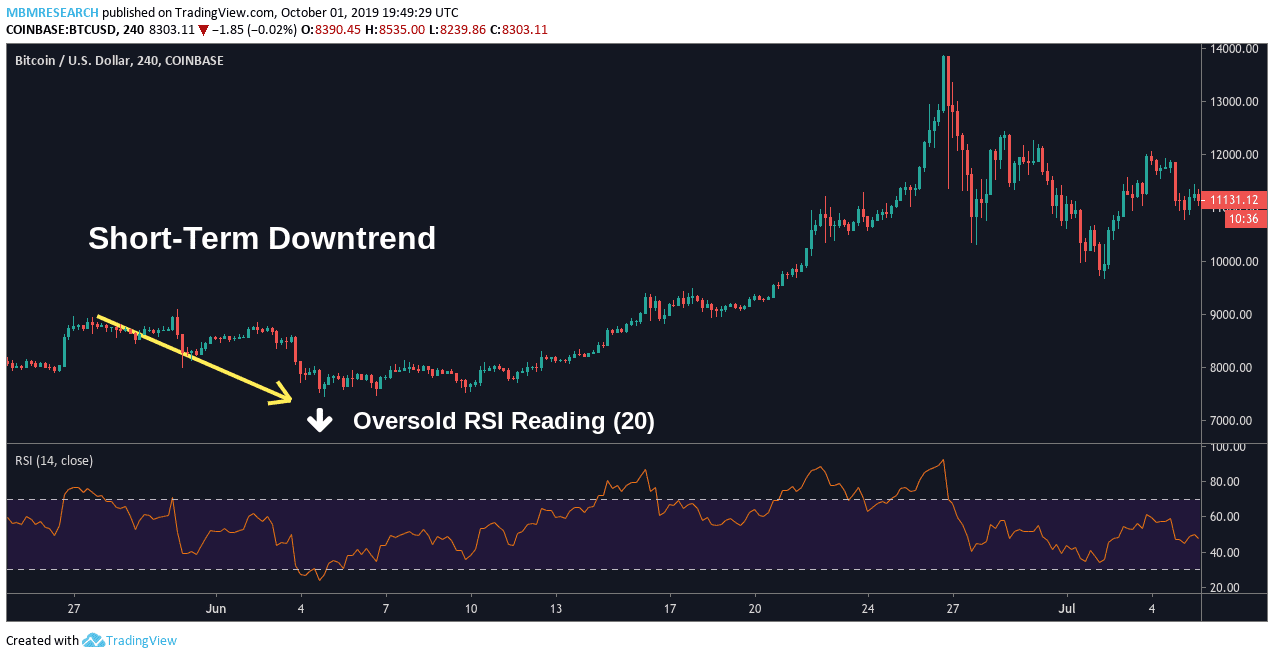
In our next RSI trading example, we can see a bullish scenario begin to unfold. Market prices in BTC/USD are caught in a short-term downtrend (left side of the chart). This sends the RSI indicator value below the oversold threshold (reaching 20). At this stage, traders would view the signal as a potential opportunity to buy BTC/USD now that the asset has become undervalued.
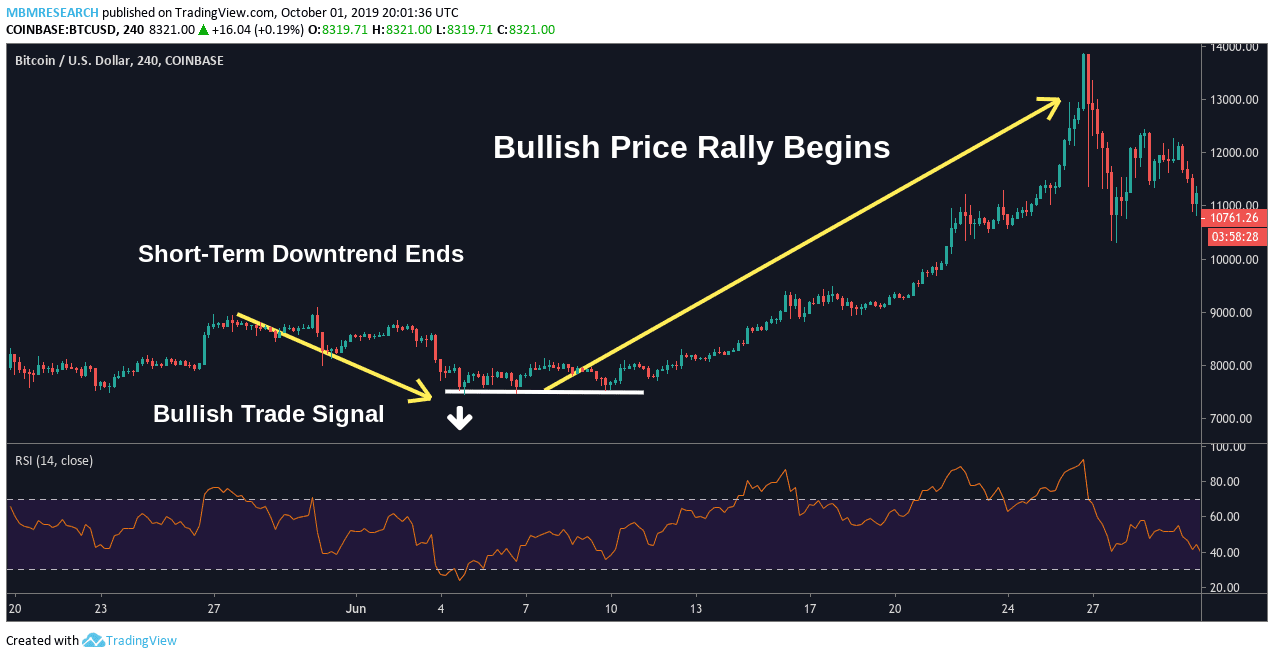
The confirming signal arrives as the RSI indicator crosses back above the 30 threshold (indicating that the short-term downtrend has completed). In this case, the same strategy rules would still apply (only in reverse). Long trades would be initiated with a stop loss below the price lows which created the overbought indicator reading on the RSI (white horizontal line). Traders will place the stop loss in this area because the buy-signal will become invalid if prices are able to move above this area in the future. Profit targets on the long position should be placed at least 3x the total risk on the trade. Once the BTC/USD short trade begins to move in a favorable direction (downward), traders can move stop losses to the break-even point (removing all risk on the trade).
RSI Divergence Strategies
Another important way expert traders use the RSI indicator is to identify price divergences. Essentially, indicator divergences can be found when a major price move (a rally or a decline) is not being confirmed by an objective statistical indicator. In practical terms, these events suggest that the market has become irrational in its behavior and that prices will need to revert back to their historical averages.
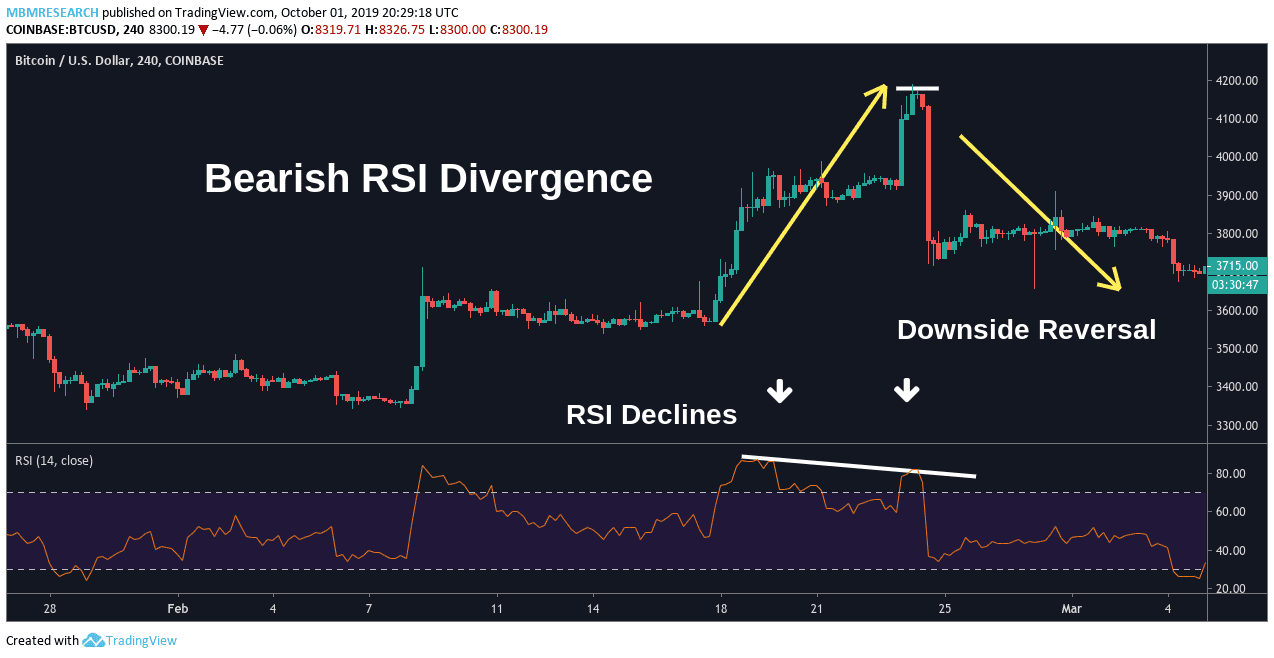
In our first RSI Divergence example, we can see that BTC/USD is caught in a strong uptrend on the 4-hour charts. However, these sharp rallies in price are not confirmed by the RSI indicator reading, which is actually moving lower even as investors are showing bullish enthusiasm and buying the asset. In this case, traders could have established contrarian short positions based on the expectation that the current bull trend is invalid. Once the investor enthusiasm begins to wear off the price moves sharply lower, following the pattern already demonstrated by the RSI indicator.
When structuring a specific trade idea based on a Bearish Divergence event, many of the same trading rules still apply. Stop losses on the short position should be placed above the price highs which accompanied the primary indicator signal (white horizontal line). Initial profit targets should be set to at least 3x the total risk on the position.
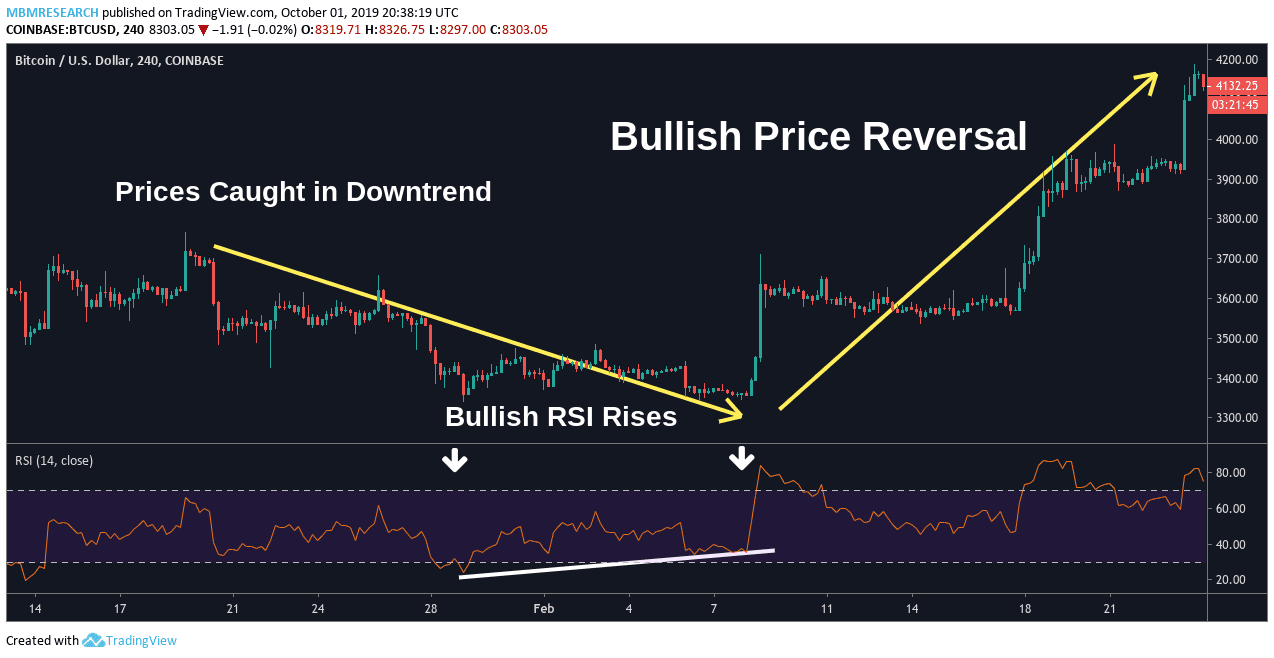
In our second RSI Divergence example, we can see that BTC/USD is caught in a strong downtrend on the 4-hour charts. However, these sharp declines in price are not confirmed by the RSI indicator reading, which is moving higher. In this case, traders could have established contrarian short positions based on the expectation that the current bear trend is invalid.
Essentially, the RSI indicator is telling us that the market needs to correct back toward their historical averages. In this case, a correction would require a move to the topside, and this would be enough for divergence traders to initiate a new long position in BTC/USD. When structuring a specific trade idea based on a Bullish Divergence event, stop losses on the long position should be placed below the price lows which accompanied the primary divergence signal. Similarly, initial profit targets should be set to at least 3x the total risk on the position.
RSI Strategy Limitations
RSI calculations compare the strength of bullish/bearish trend momentum. This information is then displayed on historical price charts as a way of alerting traders to possible reversal events in the valuation of an asset. However, these readings tend to be most predictive when assessing long-term price trends.
When viewing short-term price histories, it can be difficult to identify true reversal signals and traders are likely to encounter many false alarms. Of course, this can lead to trading losses when positions are not managed correctly, so it is important to have clear parameters in place when setting stop losses and profit targets. As a result, the RSI indicator is often used during oscillating market periods (when price trends fluctuate between bullish and bearish momentum in a stable fashion). In any event, traders must be sure to use protective stop losses in order to limit the potential for losses if market trends begin to move in an unfavorable direction.
SUMMARY
- RSI was developed by J. Welles Wilder and introduced to the financial markets in 1978.
- RSI tracks market prices a momentum oscillator, fluctuating between two charted extremes (0 and 100).
- RSI signals are considered overvalued (or “overbought”) when the indicator rises above 70 and undervalued (or “oversold”) when the indicator falls below 30.
- RSI readings tend to hold within the mid-range for a majority of the time. RSI readings above 70 indicate potential selling opportunities while readings below 30 represent potential buying opportunities.
- When RSI values extend beyond the median boundaries, the indicator is giving traders a signal which suggests a trend has become over-extended and that a reversal is ready to begin.
- RSI divergences can be found when a major price move (a rally or a decline) is not confirmed by an objective statistical indicator, suggesting the market will need to revert back to historical averages.
- The RSI indicator can use used to identify trend reversals and divergences characterizing any asset class (crypto, forex, stocks, commodities, etc.).
- When using RSI, traders must be sure to use protective stop losses in order to limit the potential for losses if market trends begin to move in an unfavorable direction.
PEOPLE WHO READ THIS ALSO VIEWED:
