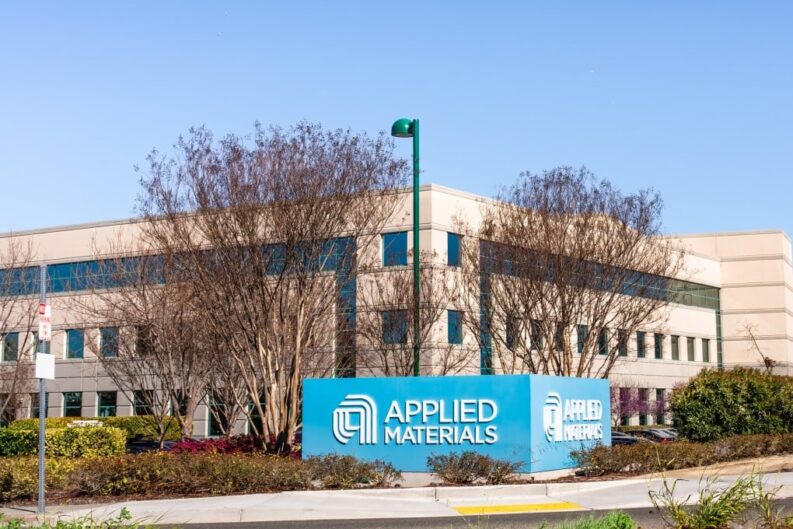
Applied Materials is a company that operates in the semiconductor industry, supplying advanced equipment, services, and software essential for manufacturing integrated circuits. As the digital world continues to expand and demand more sophisticated chips, Applied Materials plays a key role in enabling technological progress. For investors seeking to gain exposure to companies in the technological supply chain, AMAT presents what some may consider an intriguing opportunity. Understanding the cyclical nature of semiconductor capital equipment spending is key to evaluating these shares.
We cannot provide specific investment advice, but we can offer resources to help you make more informed decisions for your portfolio. Below, you can find key data on Applied Materials, including forecasts, earnings data, share price targets, and analysis.
Applied Materials Share Price & Chart
While AMAT’s earnings and sales data indicate a company growing each year, its share price has been declining since mid-2024, although it has begun to rise since April 2025. It now trades around the $174 mark (as of June 17) after a 26% decline in the past 12 months.
P/E Ratio Average (End of 2024): 18.7
Dividend Yield: 1.06%
Applied Materials EPS and Revenue Breakdown 2020-2024
Applied Materials is considered a key player in providing manufacturing equipment, services, and software for the semiconductor, display, and related industries. Founded in 1967 by Mike McNeilly and four others, the US-based company is one of the largest suppliers of semiconductor fabrication equipment in the world, based on revenue.
Applied Materials’ extensive portfolio includes products used in the semiconductor, display, solar and automation software sectors. Furthermore, the company’s solutions enable chipmakers to develop smaller, faster, and more power-efficient devices, addressing the increasing demands of artificial intelligence, high-performance computing, and the Internet of Things. Applied Materials trades on the Nasdaq stock exchange under the ticker symbol AMAT.
Applied Materials Stock Forecast
Data compiled by TradingView shows that of the 36 analysts covering the stock, 26 have a “Buy” rating, while ten have a “Hold” rating.
A View From the Bulls: In May, Berenberg analyst Tammy Qiu lifted the firm’s price target on Applied Materials to $250 from $245, maintaining a Buy rating on the stock. In a note to clients, Qiu stated that the firm’s outlook for capital expenditures (capex) in the semiconductor industry remains largely unchanged since January. The analyst noted that the potential effect on end markets from US tariffs and the artificial intelligence diffusion rules appears smaller than feared in early April. Berenberg also predicts spending on wafer fab equipment will rise by 3% in 2025 and 4% in 2026.
A View From the Bears: On the other hand, in May, Morgan Stanley took the opposite approach, with analyst Joseph Moore lowering the firm’s price target on Applied Materials to $162 from $164, while maintaining an Underweight rating on the shares. Moore told investors that, in its latest earnings release, AMAT didn’t deliver the modest upside seen at peers KLA Corp. and Lam Research, but was closer to being in line with expectations, as China declined slightly more than expected.
However, it should be noted that in June, Morgan Stanley upgraded AMAT to Equal Weight with a new price target of $158, down from $162, stating that the stock’s valuation drove the upgrade. However, the bank stated that its fiscal 2026 revenue and earnings estimates are 8% and 10% below the Street, respectively, due to a more negative leading logic and DRAM view.
Average Analyst Consensus 12-Month Price Target: $198.52
Our View: As mentioned above, Applied Materials is a key player, with its technologies supporting the development of increasingly complex and powerful chips. While the semiconductor industry experiences cycles, the long-term demand drivers, especially from AI and data centers, are robust. Additionally, its recent stock decline may be viewed as a buying opportunity. Even so, there are still headwinds to consider, and investors should remain mindful of industry-specific cyclicality and global supply chain dynamics.
Who Should Buy Applied Materials Shares
Applied Materials shares typically appeal to investors seeking core exposure to the semiconductor industry.
The stock is potentially attractive to those looking for a company involved in the manufacturing of integrated circuits worldwide.
Additionally, as Morgan Stanley noted,its current valuation may be appealing to some investors.
It may also be a suitable fit for investors who believe in the growth of artificial intelligence, advanced computing, and connectivity.