Haleon Shares Confirm a Death Cross at Tuesday’s Close
Haleon shares have confirmed a Death Cross, with the 50-day moving average crossing below the 200-day moving average at Tuesday’s close, as the consumer healthcare group’s stock trades well below its 52-week high.
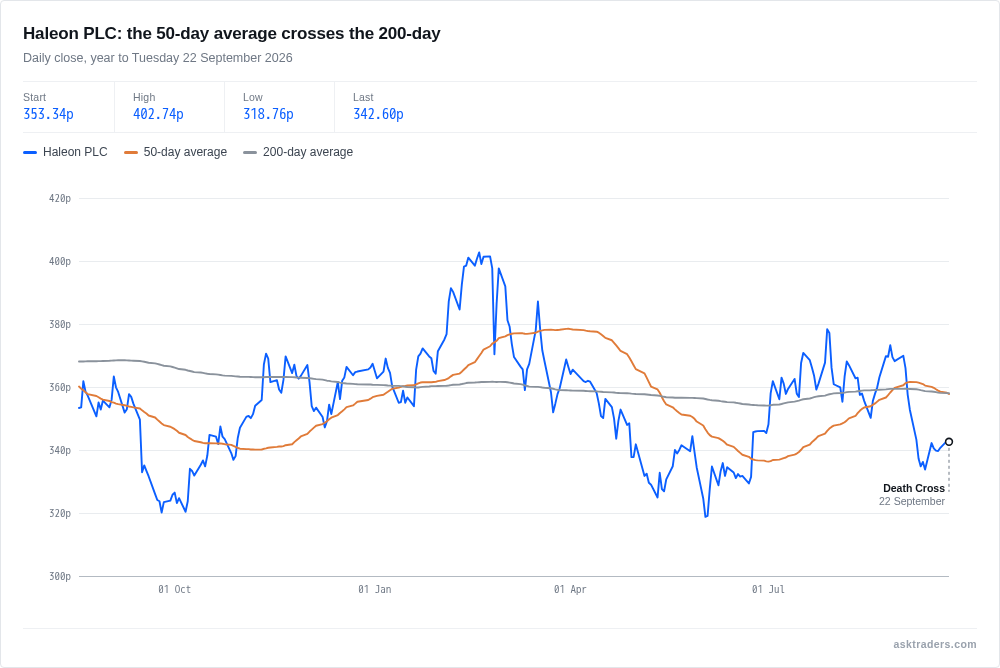
Haleon (LON: HLN), the FTSE 100 consumer healthcare group behind brands including Sensodyne, Panadol, Voltaren, Advil and Centrum, has recorded a Death Cross, with its 50-day simple moving average crossing below its 200-day simple moving average at Tuesday’s close.
The shares closed at 342.6p on Tuesday, having traded in a range of 342.4p to 346.6p during the session, a narrow band that left the stock little changed on the day.
A Death Cross occurs when a shorter-term moving average, here the 50-day, falls below a longer-term one, the 200-day, showing recent trading has weakened relative to the past year’s trend. It is a lagging signal, built from price action that has already happened, not a forecast of what comes next.
Sponsored content
Ready to put what you’ve learned into practice?
Try IG’s platform with £10,000 in virtual funds and practise trading
without putting your own money at risk.
Spread bets and CFDs are complex instruments and come with a high risk of losing money rapidly due to leverage. 69% of retail investor accounts lose money when trading spread bets and CFDs with this provider.
Sponsored content
Learn the markets with IG Academy
Build your knowledge with IG Academy educational content, then use a
demo account to practise what you’ve learned on the IG platform.
Spread bets and CFDs are complex instruments and come with a high risk of losing money rapidly due to leverage. 69% of retail investor accounts lose money when trading spread bets and CFDs with this provider.
Sponsored content
See how trading works before risking real money
IG’s demo gives you access to thousands of markets and £10,000 in
virtual funds, so you can explore the platform and test your ideas first.
Spread bets and CFDs are complex instruments and come with a high risk of losing money rapidly due to leverage. 69% of retail investor accounts lose money when trading spread bets and CFDs with this provider.
Sponsored content
Turn trading theory into practical experience
Learn with IG Academy, explore charts and market tools, and practise
strategies in a simulated trading environment before going live.
Spread bets and CFDs are complex instruments and come with a high risk of losing money rapidly due to leverage. 69% of retail investor accounts lose money when trading spread bets and CFDs with this provider.
Sponsored content
Ready to take your learning further?
IG combines market education, analysis and an established trading platform,
giving you the tools to keep learning as you develop your trading skills.
Spread bets and CFDs are complex instruments and come with a high risk of losing money rapidly due to leverage. 69% of retail investor accounts lose money when trading spread bets and CFDs with this provider.
At Tuesday’s close the two averages sat close together, with the 50-day at 357.78p against a 200-day of 358.02p, a gap of just 0.24p.
The stock was little changed on the day, down just 0.06%, but it sits 14.9% below its 52-week high and 7.5% above its 52-week low, underlining how far the shares have fallen from their peak even as they hold above their low for the period. Haleon shares are down 6.7% so far this year. Turnover on Tuesday ran to 39,192,372 shares, 1.37 times the 20-session average of 28,547,487, a level of activity above the recent norm as the crossover was confirmed.
Haleon PLC daily share price with 50-day and 200-day moving averages, year to Tuesday 22 September 2026
How unusual this is
There is no prior instance of this crossover on record for Haleon, making Tuesday’s confirmation the first Death Cross the data shows for the stock. The 50-day average has drifted below the 200-day line as the shares have traded down over recent months, taking the stock further from the highs it set earlier in the 52-week range.
Sponsored
The elevated relative volume of 1.37 times the recent average suggests the shift was accompanied by heavier-than-usual trading rather than passing unnoticed.
The two averages remain close together, with the 50-day average at 357.78p against a 200-day average of 358.02p, a gap of just 0.24p at Tuesday’s close.
The AskTraders Analyst Team features experts in technical and fundamental analysis, as well as traders specializing in stocks, forex, and cryptocurrency.