
What is a Pivot Point in Forex
By applying technical analysis, Forex pivot points are widely used by traders to gauge bullish or bearish market sentiment. There are multiple types of Forex pivot points, with the standard method of calculating pivot points being the most popular.
Forex pivot points are identified in order to determine “interesting” levels. These are marked by traders to note points where the market could change from “bullish” to “bearish.” Hence, traders of financial markets use these points to identify support and resistance levels.
Types of Pivot Points Used in Forex Trading
There are multiple types of pivot points that forex traders use, with the standard method of calculating pivot points being the most popular. Other than that, there are other techniques that are used to calculate forex pivot points, including:
- Floor pivot points, also known as standard or classical pivots, use a specific formula to identify support and resistance levels;
- Fibonacci pivot points use important Fibonacci levels to determine where support or resistance is located;
- Camarilla pivot points use mathematical formulas to generate potential support and resistance levels;
- Tom DeMark’s pivot points focus on the most recent data to identify potential turning points;
- Woodie pivot points are calculated from past price points.

How to Calculate Pivot Points
Each of these pivot points types is calculated differently. For some, the idea of looking at a pivot point formula for trading might seem overly complicated. However, the math behind these formulas is relatively basic.
For instance, the formula for standard (floor) pivot points calculations is as follows:
Resistance 1 (R1) = (Pivot Point x 2) – Low
Resistance 2 (R2) = Pivot Point + (High – Low)
Pivot Point (PP) = (High+Low+Price Close) / 3
Support 1 (S1) = (Pivot Point x 2) – High
Support 2 (S2) = Pivot Point – (High – Low)
Once calculated, Forex traders mark these levels on a chart. Daily traders tend to calculate daily pivot points using the data from the previous trading session.
Support and Resistance Levels
As noted above, pivot points are used to identify support and resistance levels on a chart. Once calculated, these are then marked on the chart to determine where the market may stop or accelerate its run.
Therefore, pivot points are practical technical tools that can help us mark the resistance and support levels. In layman terms, Resistance levels indicate where there will be a surplus of sellers and vice versa.
These two refer to an upper or lower obstruction that is facing the price action. Once the price movements touch these levels, we expect a certain type of reaction. For this reason, we use pivot points to identify levels that may attract the price action.
How to Trade Forex with Pivot Points
In general, there are two types of traders: Those that look to trade breakouts and those who prefer breakouts. Both groups can base their trades on pivot points. This versatility and easy-to-use are exactly what makes pivot points popular.
In the example below, we see the EUR/USD chart. Based on the classic formula, we calculated pivot points based on the data from a weekly chart. In a range trading style that is mostly used by day traders, we simply sell the pair when it approaches R1. Conversely, we should look to buy the pair when price action reaches S1.
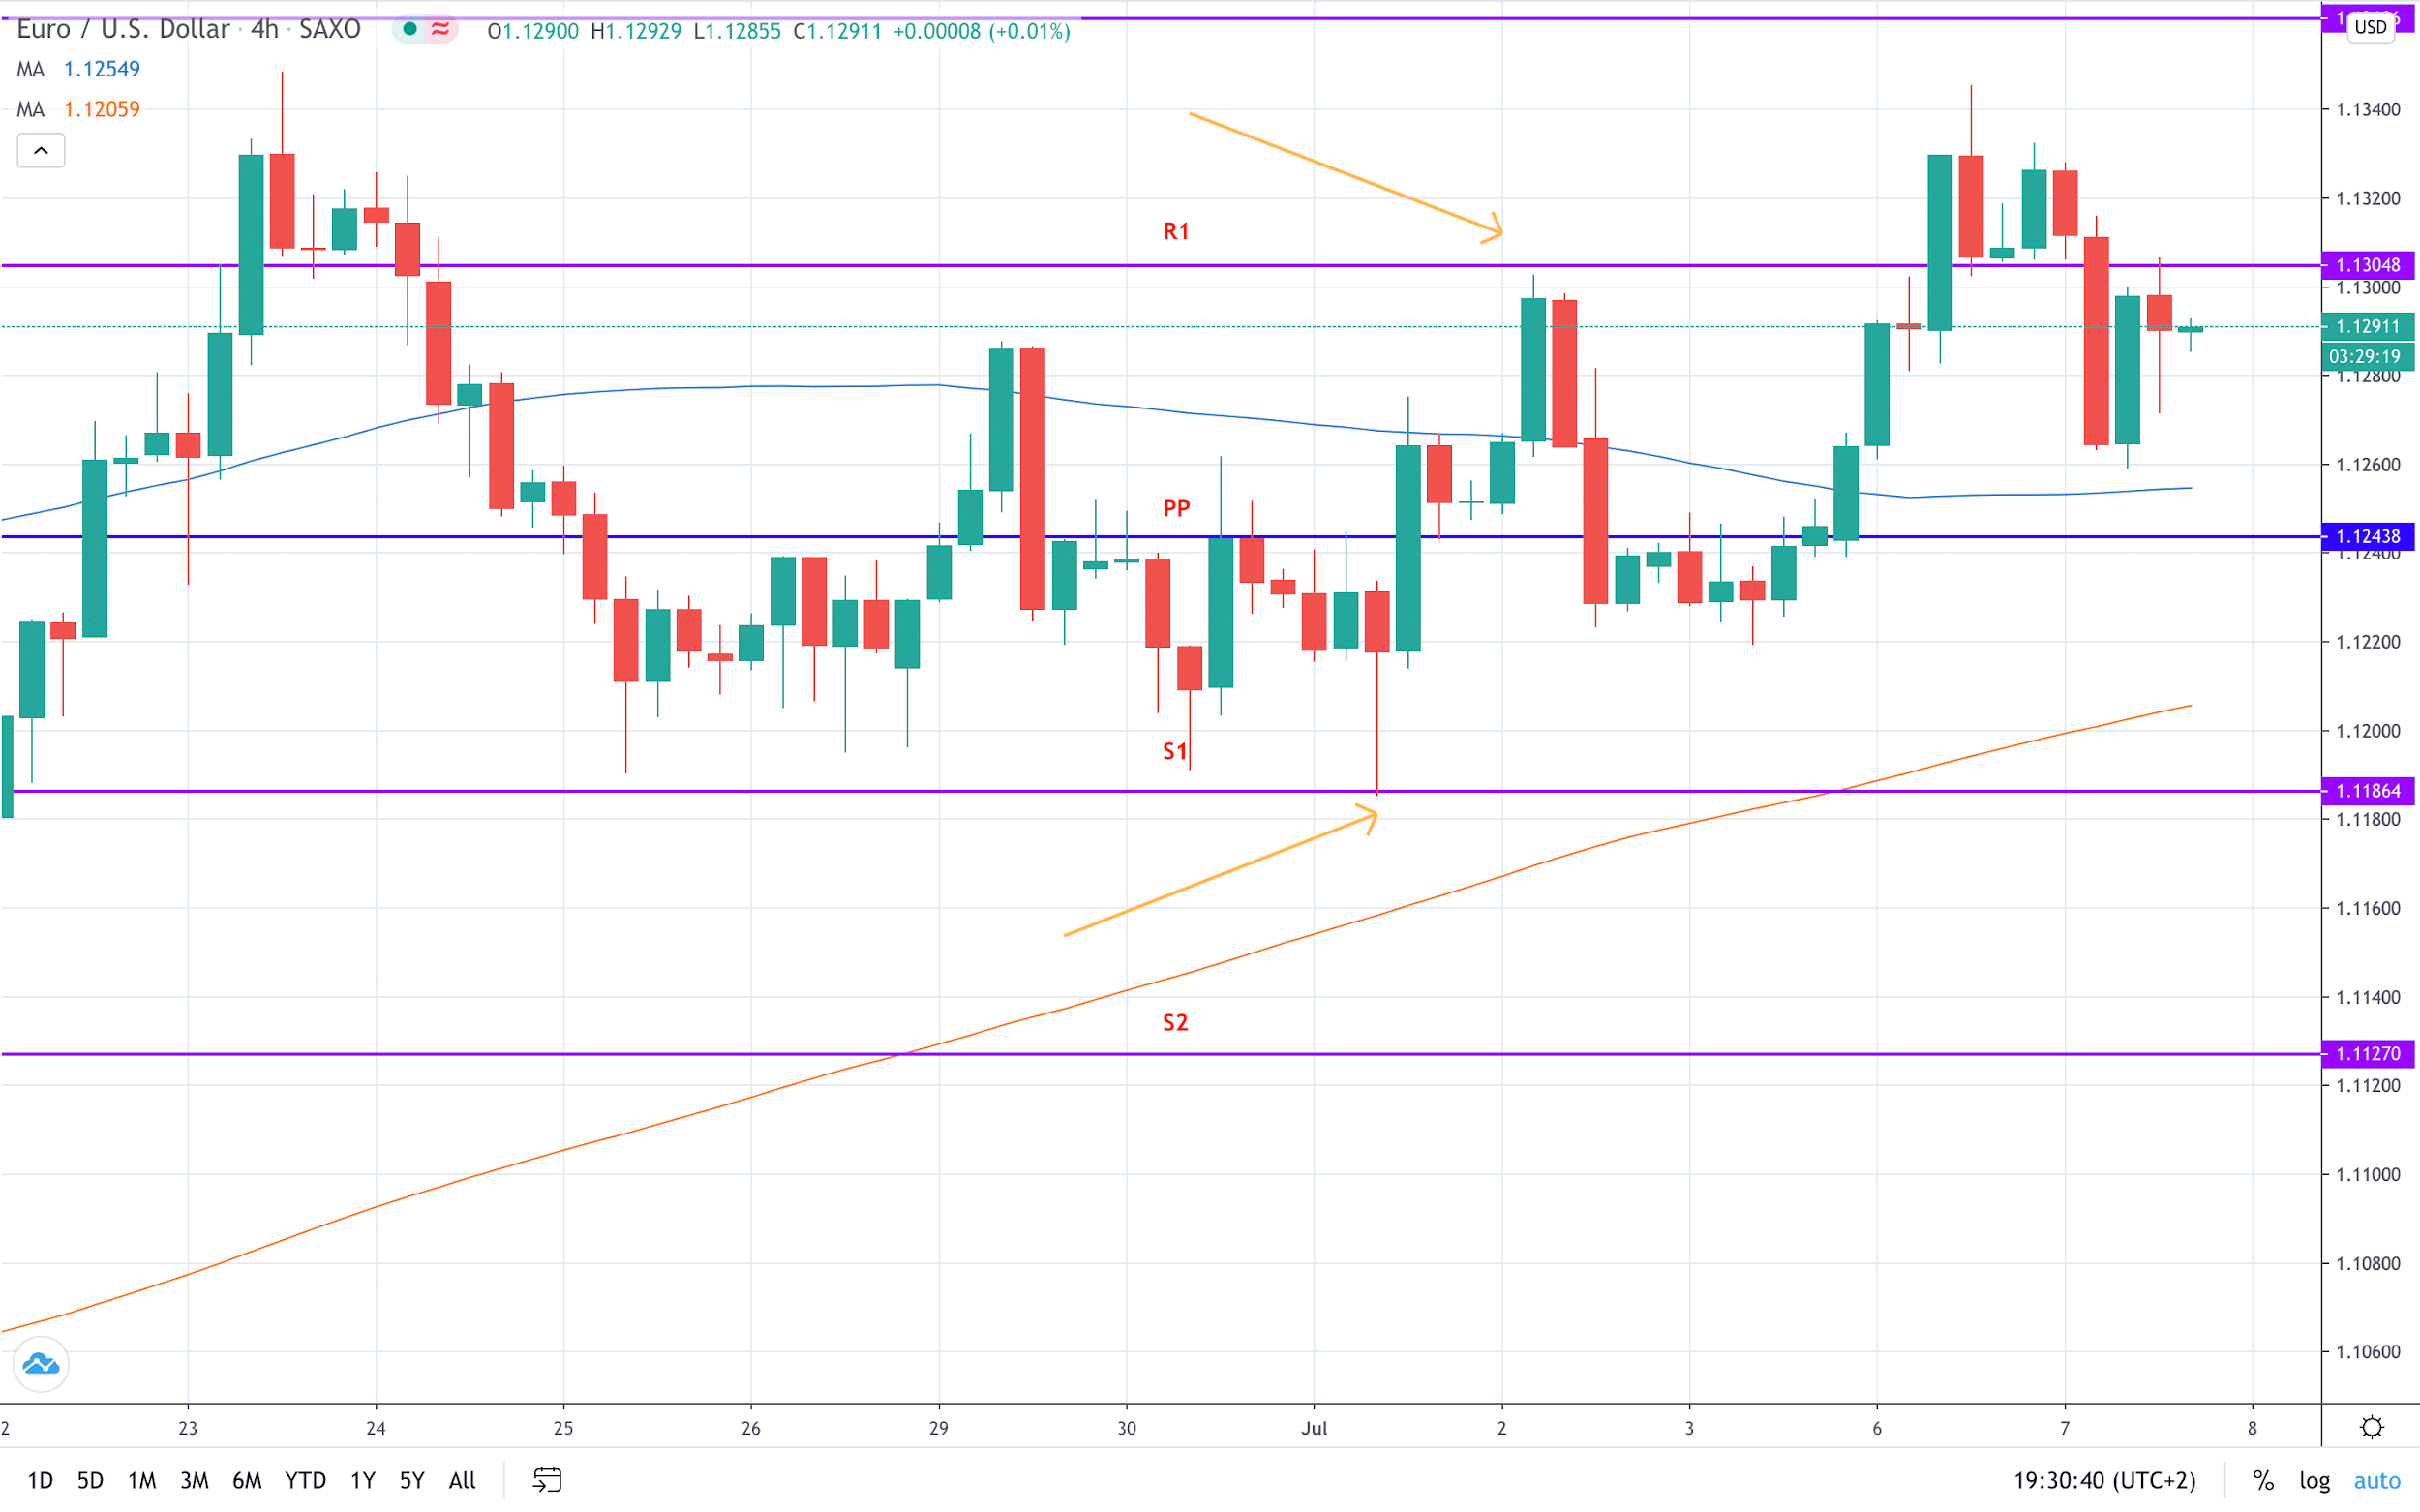
The stop-loss should be placed above R1 if we are selling, and below S1 if we are buying. This way, a stop-loss order is usually near, hence you will avoid high-risk trades. A break of these price levels means that our trade idea is invalidated. Believers in range trading will keep selling and buying until the market environment moves from ranging to trading.
The opposite approach is based on breakouts. While using the same example, we see that EUR/USD breaks through the R1, after ranging between S1 and R1. Breakout traders will advise buying a break above R1 and below S1. This way, you have practically decided to adopt the “ride the trend” strategy.
Pivot Point Forex Trading Strategies
In addition to breakouts and range trading, traders use other pivot point trading strategies. Here, we will share two basic pivot points trading strategies to further advance your Forex trading arsenal.
Trading Pivot Points with MACD
The moving average convergence/divergence (MACD) is a popular trading indicator. It is mainly used to gauge the market’s strength, direction, momentum, and duration of a trend.
We use the same example to demonstrate how to combine pivot points and MACD. In the bottom part of the page, you see a separate window for MACD. Two lines – MACD (the blue line) and signal (the yellow line) – are interacting with each other.
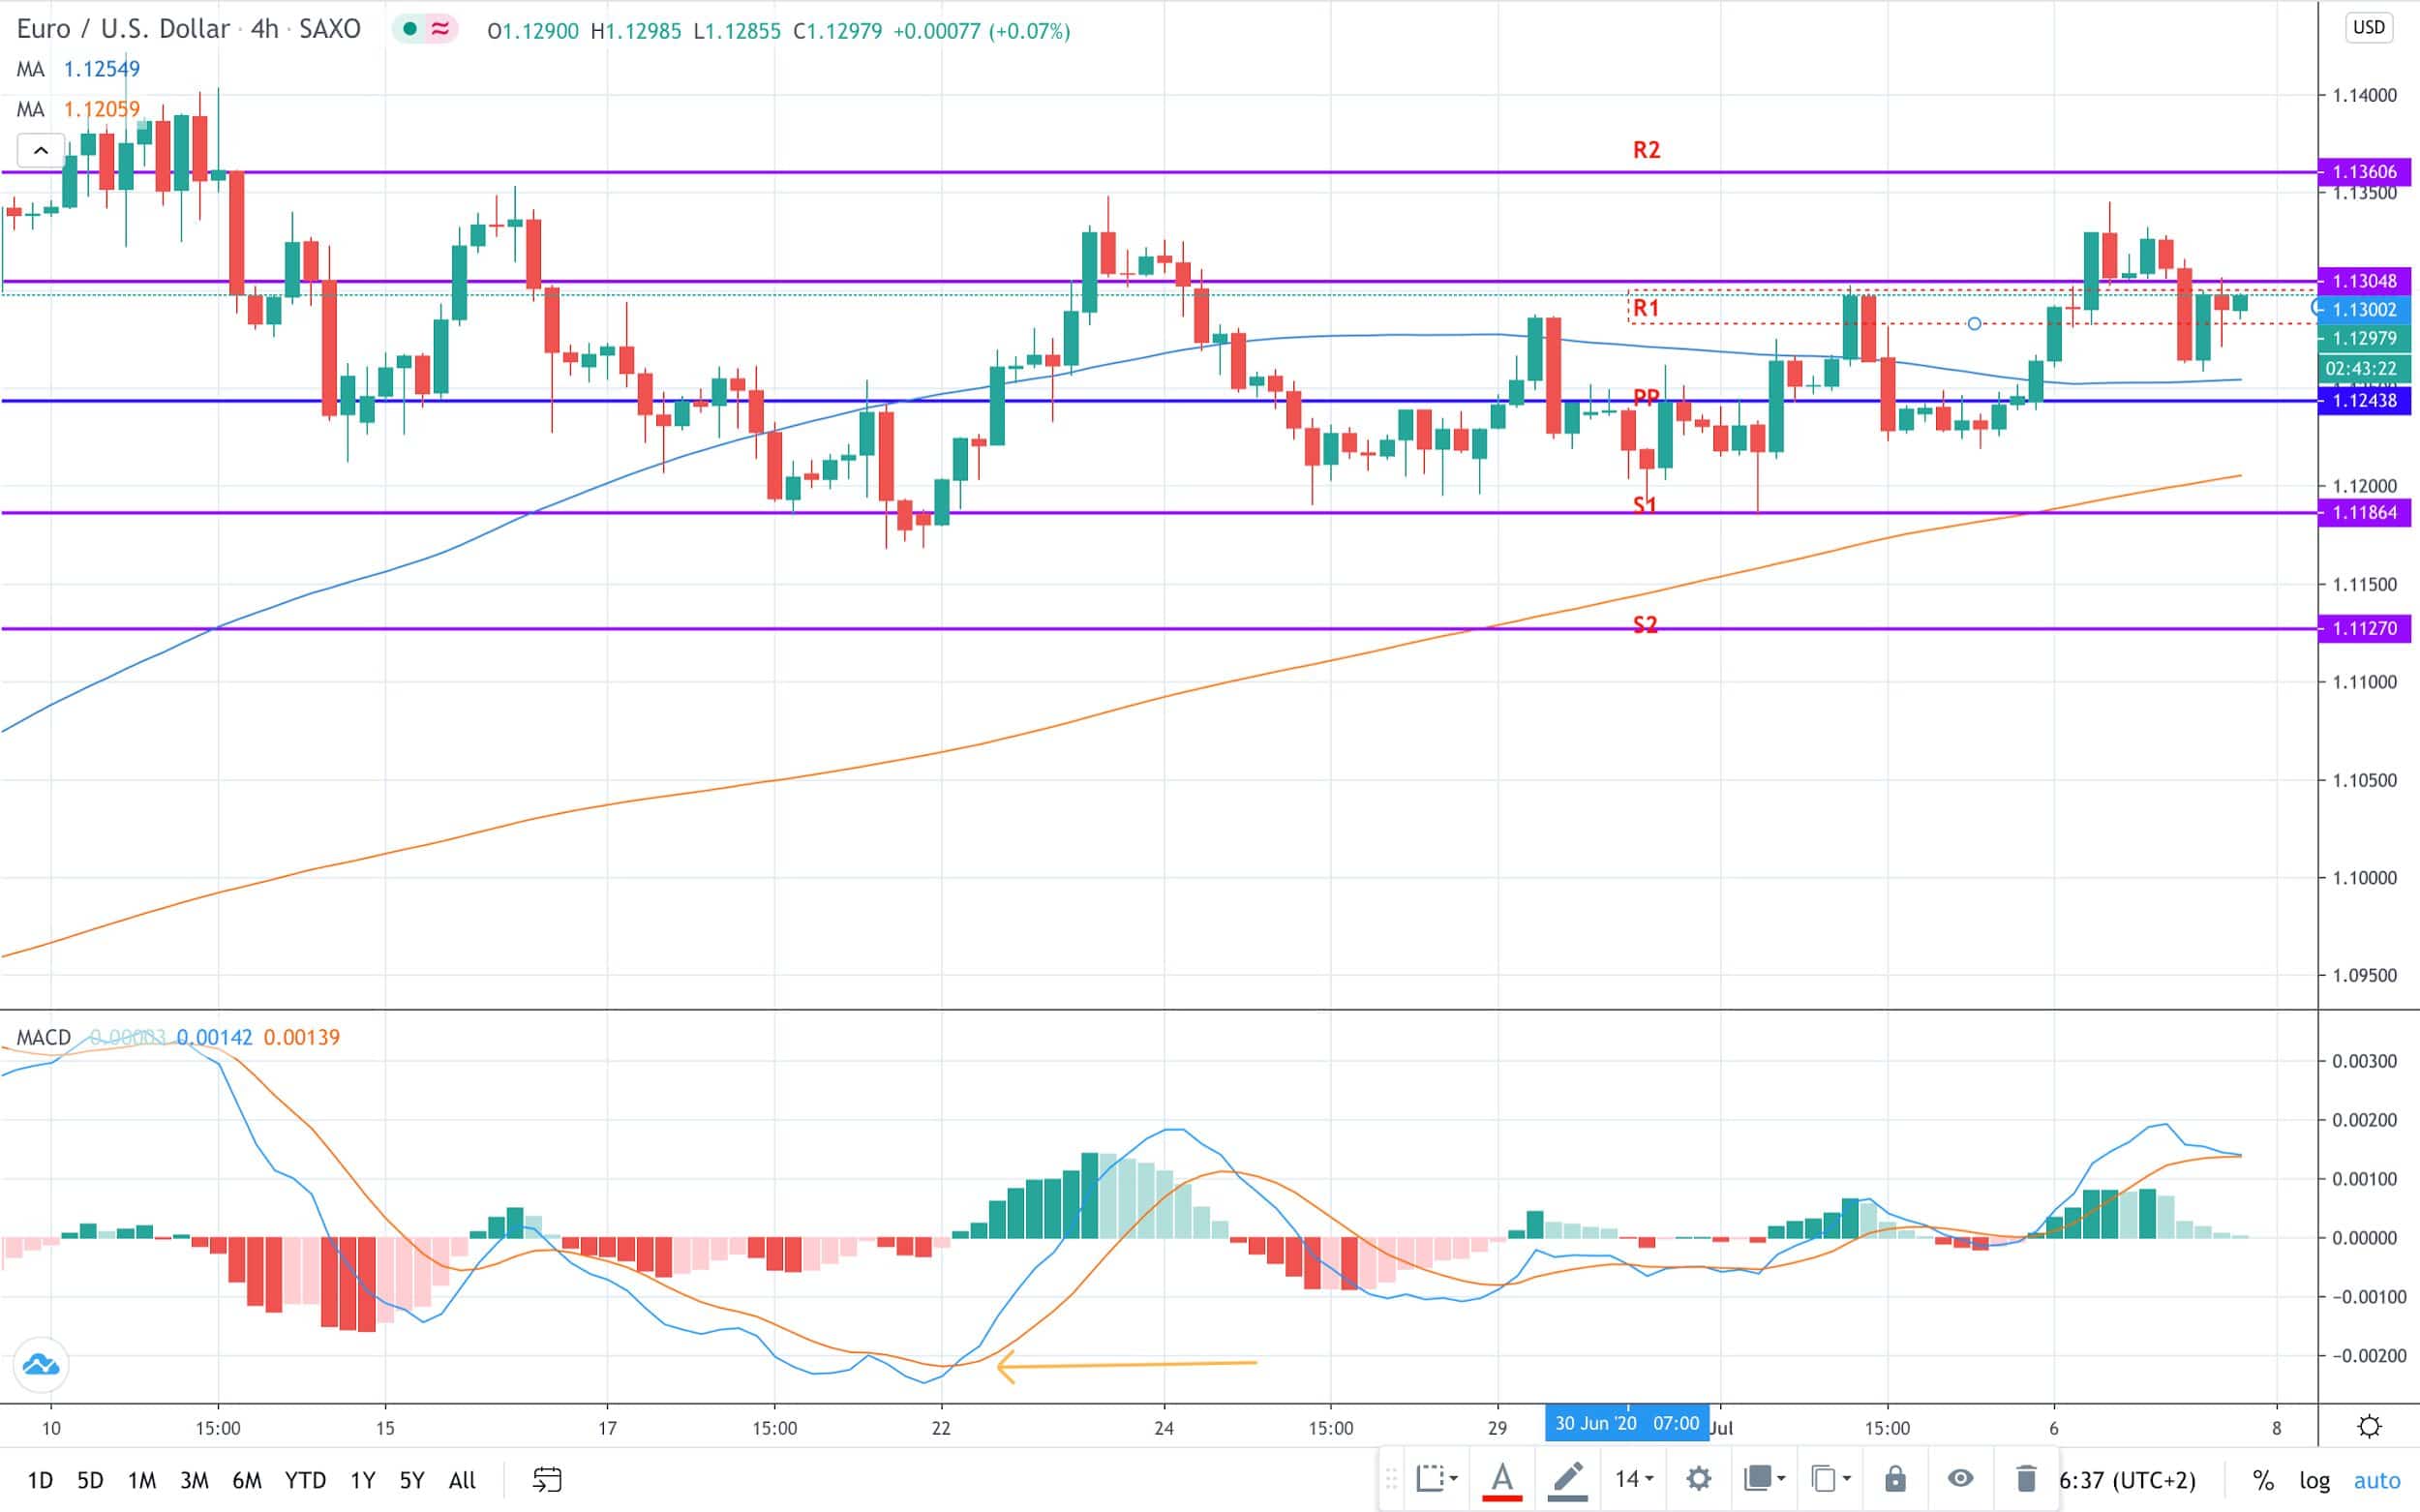
Once the short-term line – MACD – moves above the slower line – Signal – a buy signal is initiated. This signal is then cross-checked with the price action to verify whether the price is near the pivot points support.
The yellow arrow at the bottom shows a crossover that coincides with the price action trading at the S1. A long position should be taken with a stop-loss placed below S1. Setting a profit-taking order depends on your R:R preferences. In general, a move back to PP is advised as a target.
Trading Pivot Points using RSI divergence
The relative strength index (RSI) is arguably the most commonly used momentum indicator. Among other things, it produces divergence signals that are used to generate trade ideas.
In this particular case, we notice the RSI positive divergence. This means that the price drops but the RSI is moving higher. A positive divergence generates a buy signal as the price action is expected to catch up with the RSI.
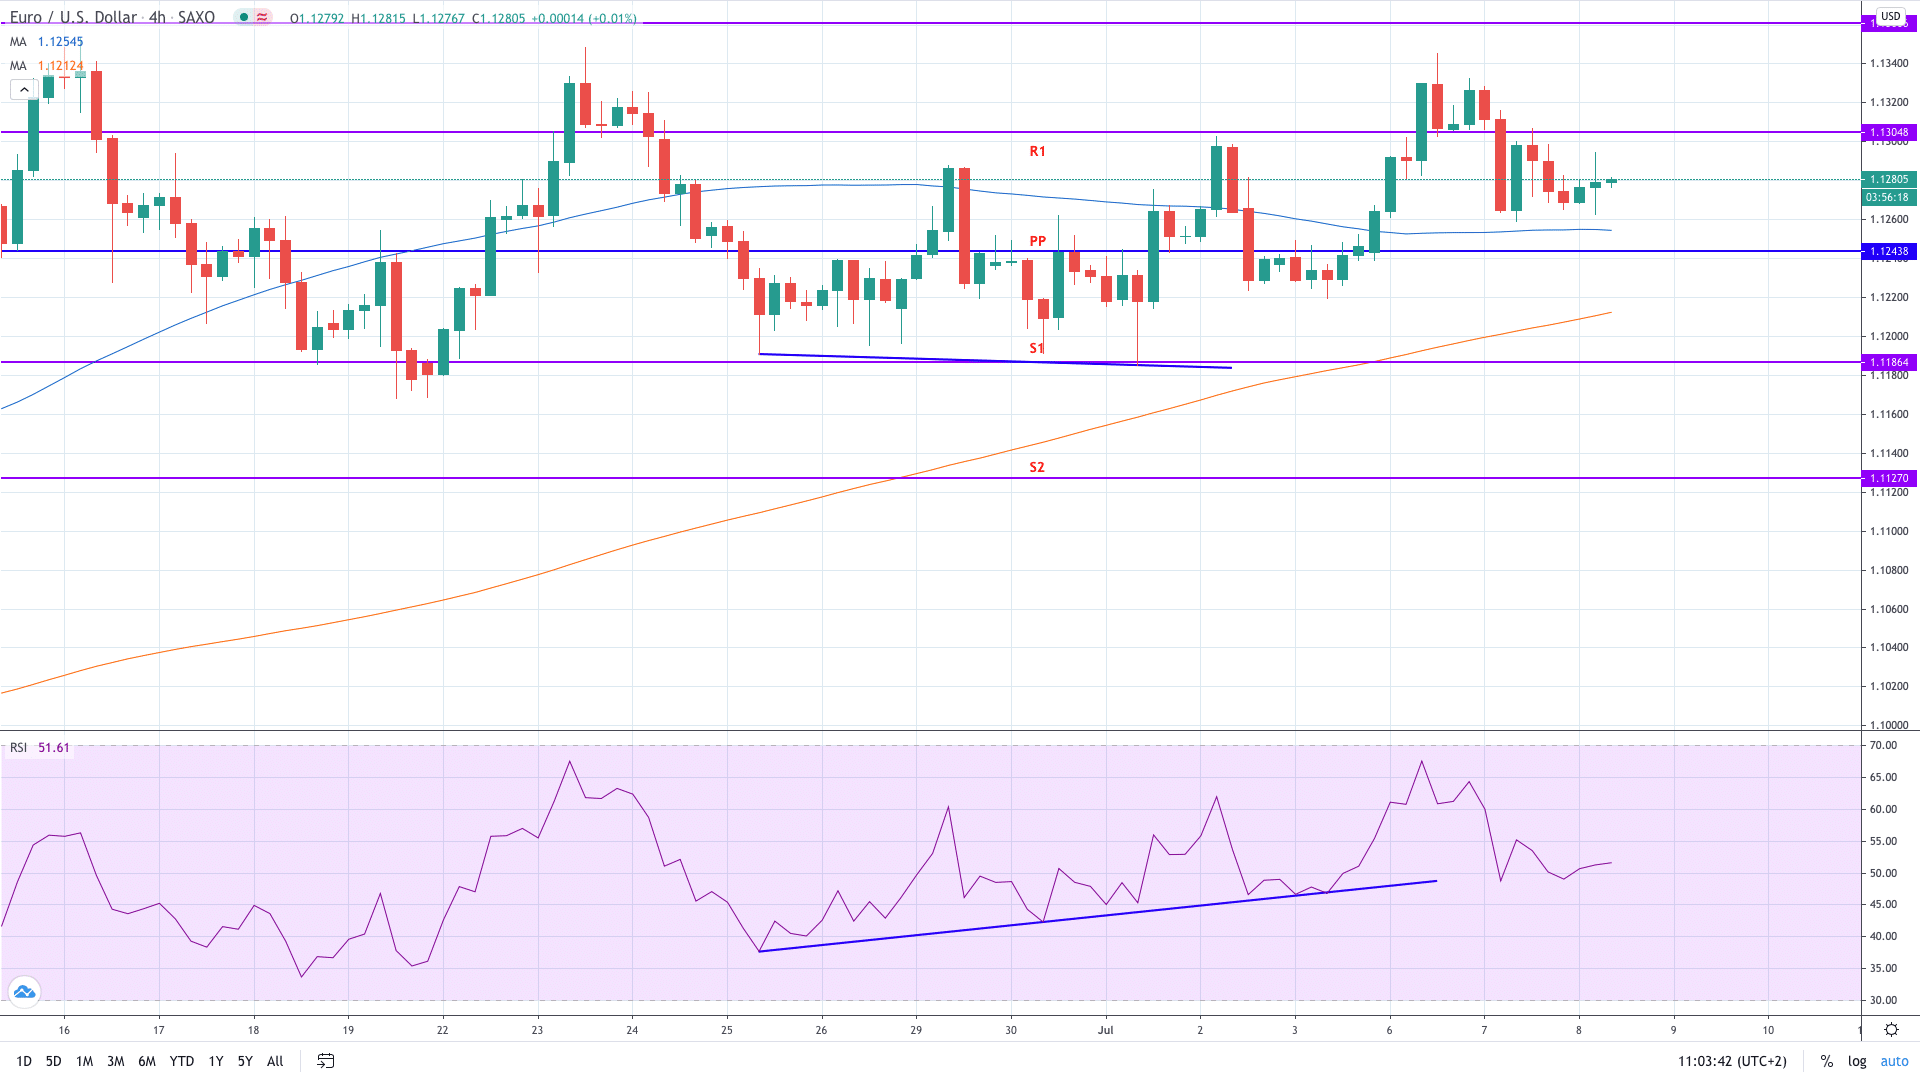
Similarly to the MACD trading strategy, the positive divergence takes place near S1. Hence, we take a long position in EUR/USD, targeting a move back to PP. A more aggressive trading style could also aim for a trip to R1.
Summary
- Forex pivot points is a technical indicator used to determine potential turning points in the price action;
- There are multiple types of Forex pivot points, with the standard method of calculating pivot points being the most popular;
- Traders often use pivot points to trade range and breakout markets;
- Pivot points are regarded as a valuable tool to trade different financial instruments;
- Using the MACD and RSI to trade pivot points can be very profitable.