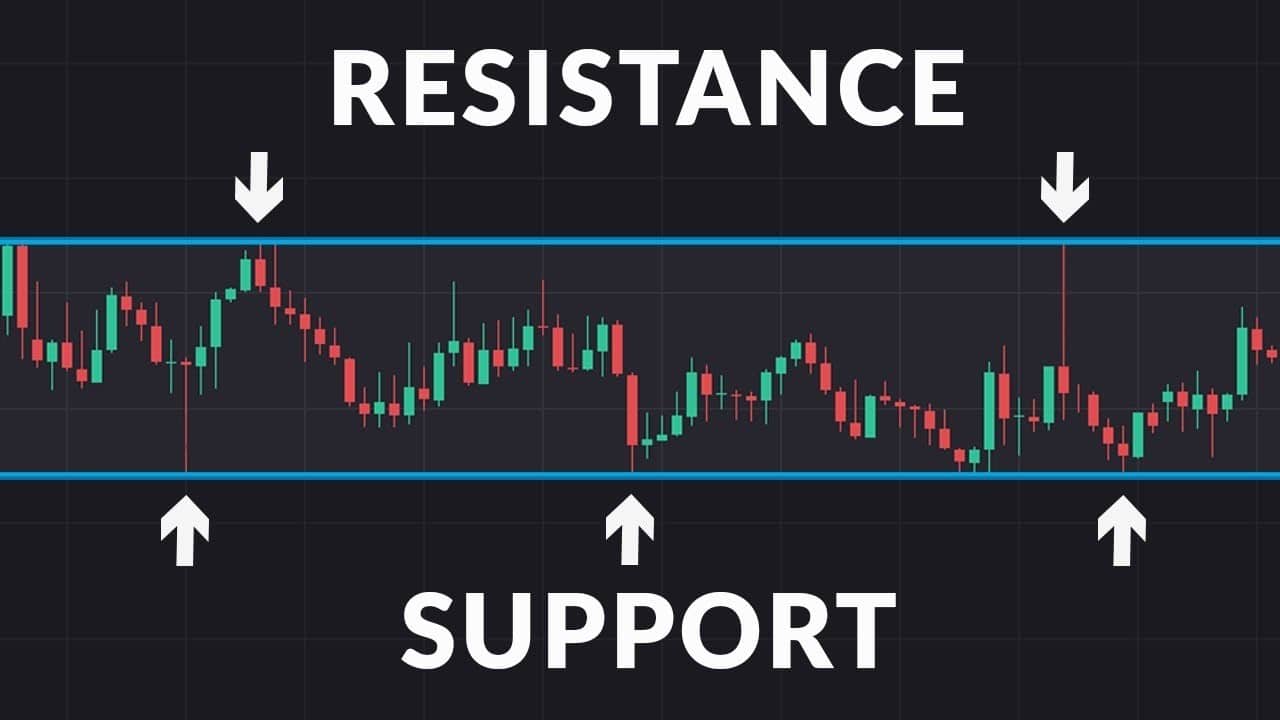
Support and resistance are trading levels on a chart that tend to act as barriers. Once identified by traders and analysts, support and resistance price levels are marked as price points where price may pause, stop, or reverse its movements.
YOUR CAPITAL IS AT RISK
In this guide, you’ll learn:
- What are support and resistance levels and how they work in practice
- How to identify support and resistance
- Learn to draw these levels on a chart correctly
- How to trade support and resistance levels
What Are Support and Resistance Levels?
A resistance level is best likened to an upper ceiling trading limit, above which the financial instrument won’t rise. Traders perform technical analysis to identify where the buyers may face challenges during an uptrend.
A support level, on the other hand, can be seen as the metaphorical floor that prevents the price from travelling below those levels – at least in theory. Hence, a support level is likely to help buyers to pause a downtrend due to a concentration of demand or buying interest.
How to Find Support and Resistance Levels
Support and resistance levels are identified on a chart by conducting technical analysis. Analysts and traders apply different technical indicators to find support and resistance levels. Price points where the price may slow down or stop are then marked on the chart. Round numbers also tend to act as psychological support and resistance levels.
When the price action approaches these levels, traders contemplate buying or placing sell orders at support and resistance levels. The logic behind this is that the price movements are more likely to react from the technically-important levels.
Why are support and resistance useful for traders?
Understanding how support and resistance zones work in trading is of paramount importance for traders. Support and resistance levels have a direct bearing on when to open and close trading to gain a profit. A strong trading strategy is based on identified support and resistance levels that are to be monitored throughout the day.
This is why you have to be able to set these levels accurately. Below, we will share the most commonly used technical indicators for finding support and resistance levels.
How to Draw Support and Resistance Lines
As outlined above, support and resistance levels are important price points identified to help us predict future market moves. In the example below, we see the EUR/USD daily chart. By simply connecting two or more important price points based on past performance, we identify horizontal support and resistance levels.
You see that the price action was prompted to react almost every time. This should be seen as a sign that we correctly drew support and resistance levels as the market is finding a reason at these levels to react.
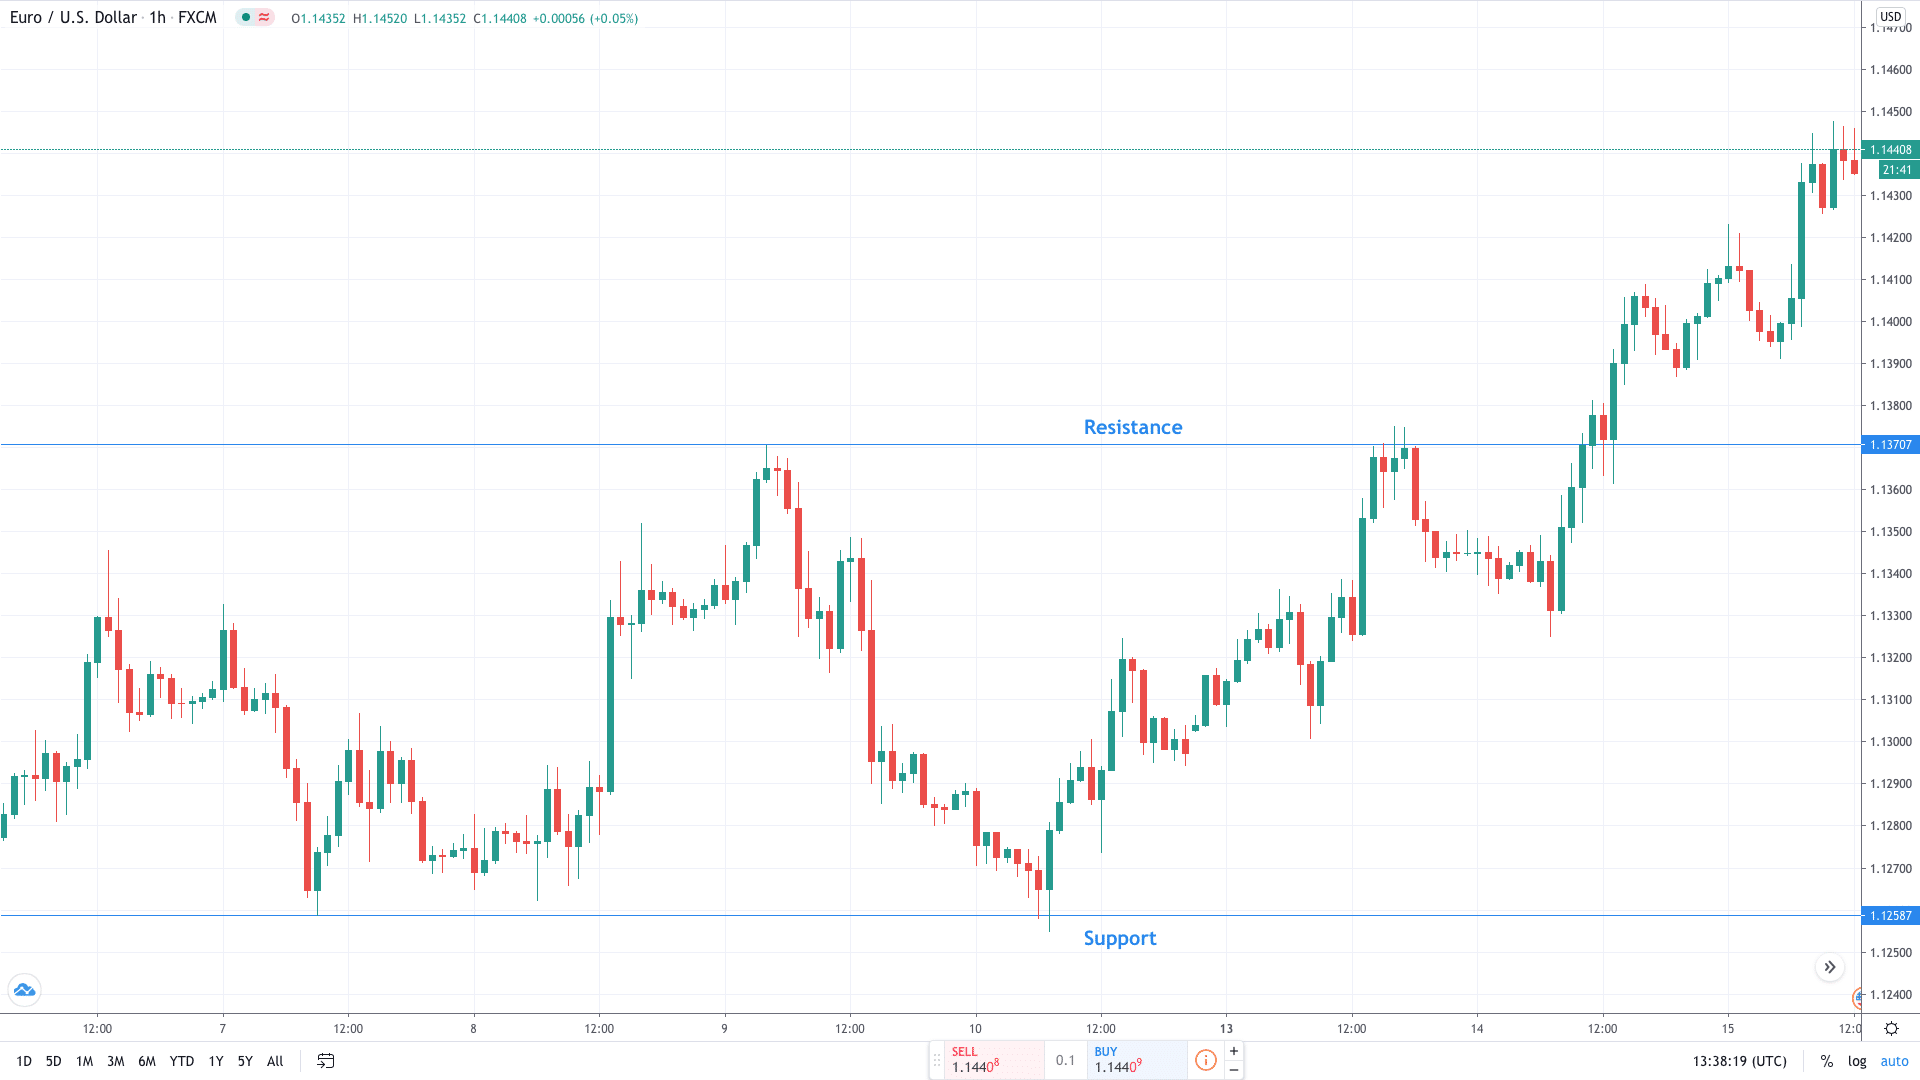
It is important to note that if price breaks below support on a high volume, then that support level can become the new resistance level, and vice versa.
The Best Support And Resistance Indicators
Here, we share the best technical indicators and techniques for finding support and resistance levels.
Fibonacci Levels
The primary goal of Fibonacci retracement and extension levels is to help us identify support and resistance levels. The key Fibonacci retracements are at 38.2%, 50%, and 61.8%, in addition to 127.2% and 161.8% extensions.
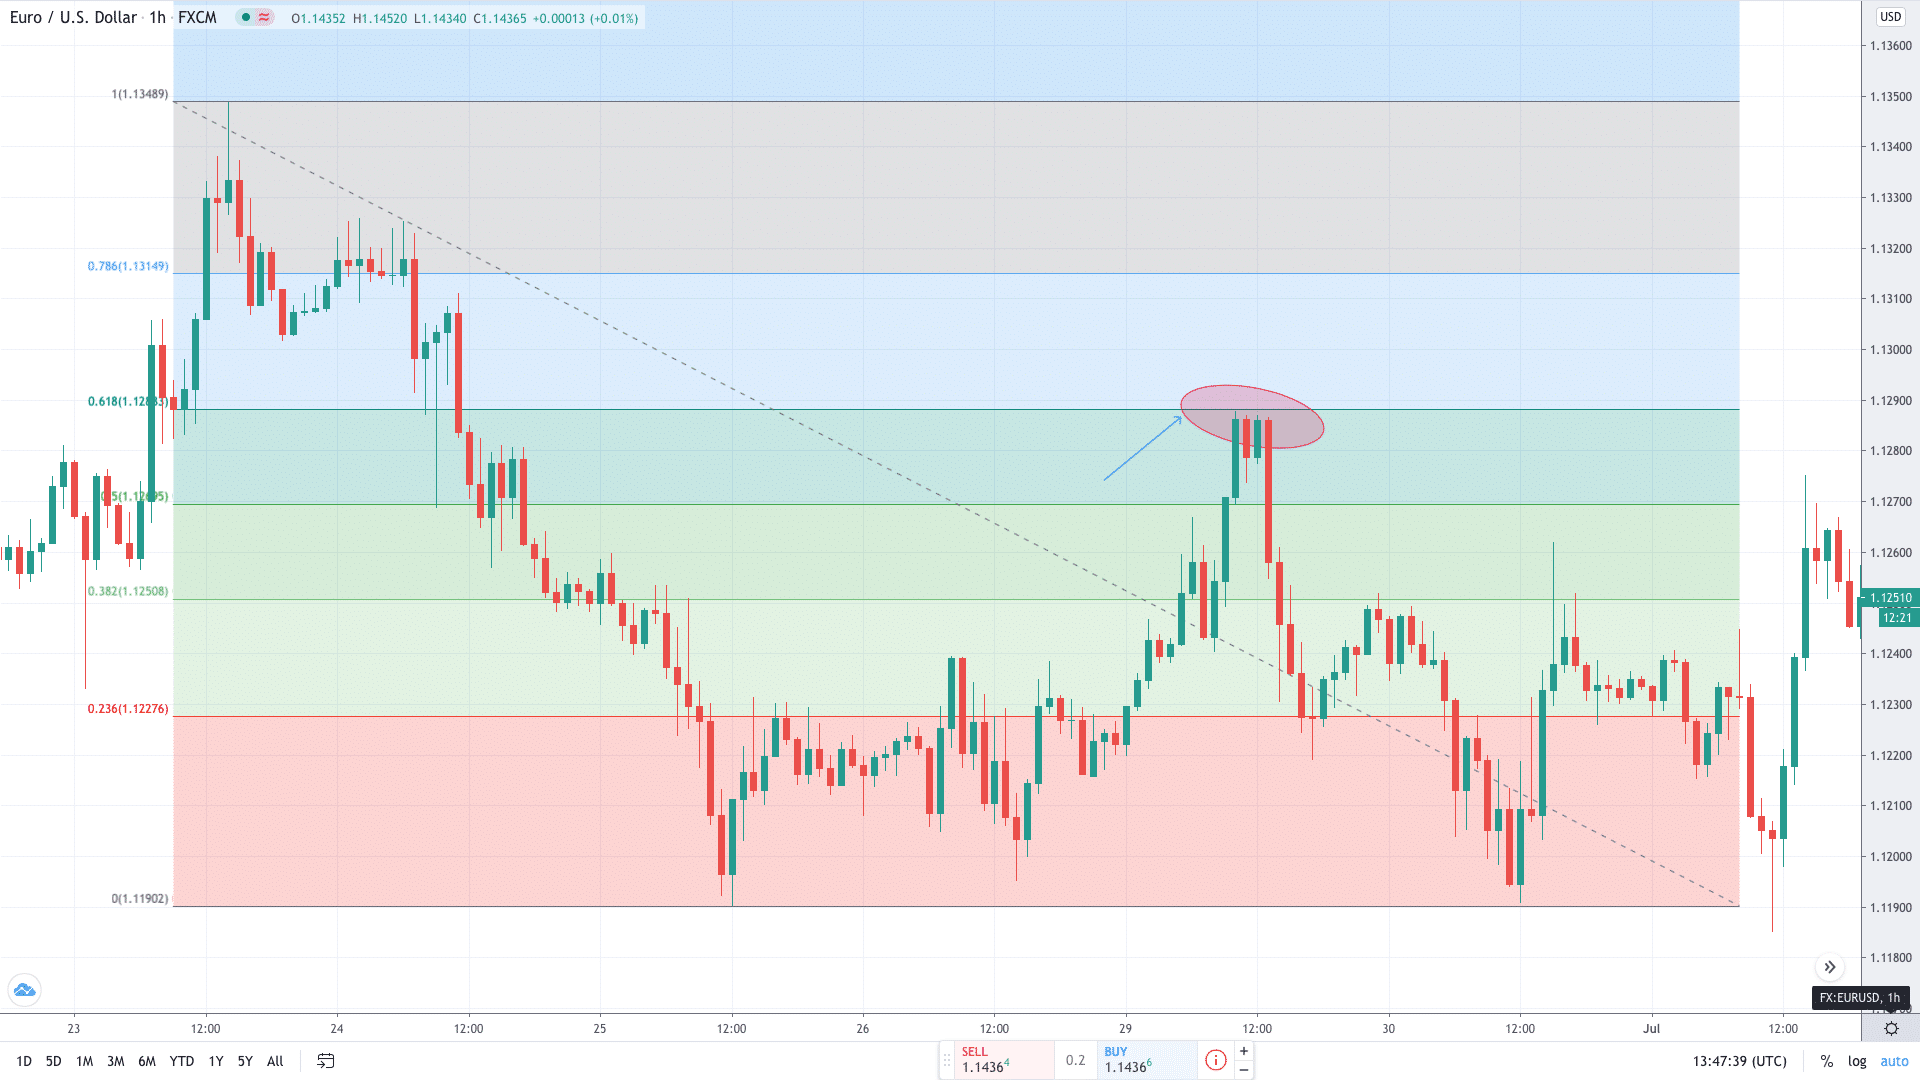
In the chart above, we drew Fibonacci retracement in the EUR/USD hourly chart. Our aim is to identify key levels where the price is likely to retrace after moving lower. As you can see, the 61.8% Fibonacci resistance level acts as resistance and prompts the price action to change its course.
Horizontal Support and Resistance
As we have seen from the first chart illustration, support and resistance levels can be identified by drawing a simple trend line. As a general rule, a trend line should connect at least two important dots on a chart.
Horizontal trend lines are one of the most commonly used technical indicators. This is due to their simplicity and easy-to-use features. In ranging financial markets, the price action tends to bounce off horizontal support and resistance levels until a break occurs.
Trend lines and Channels
We said earlier that trend lines work to connect at least two important dots on a chart. In most cases, trend lines tend to be of a diagonal nature. There is a high probability that the market reacts strongly to a level that connects a higher number of identified price points.
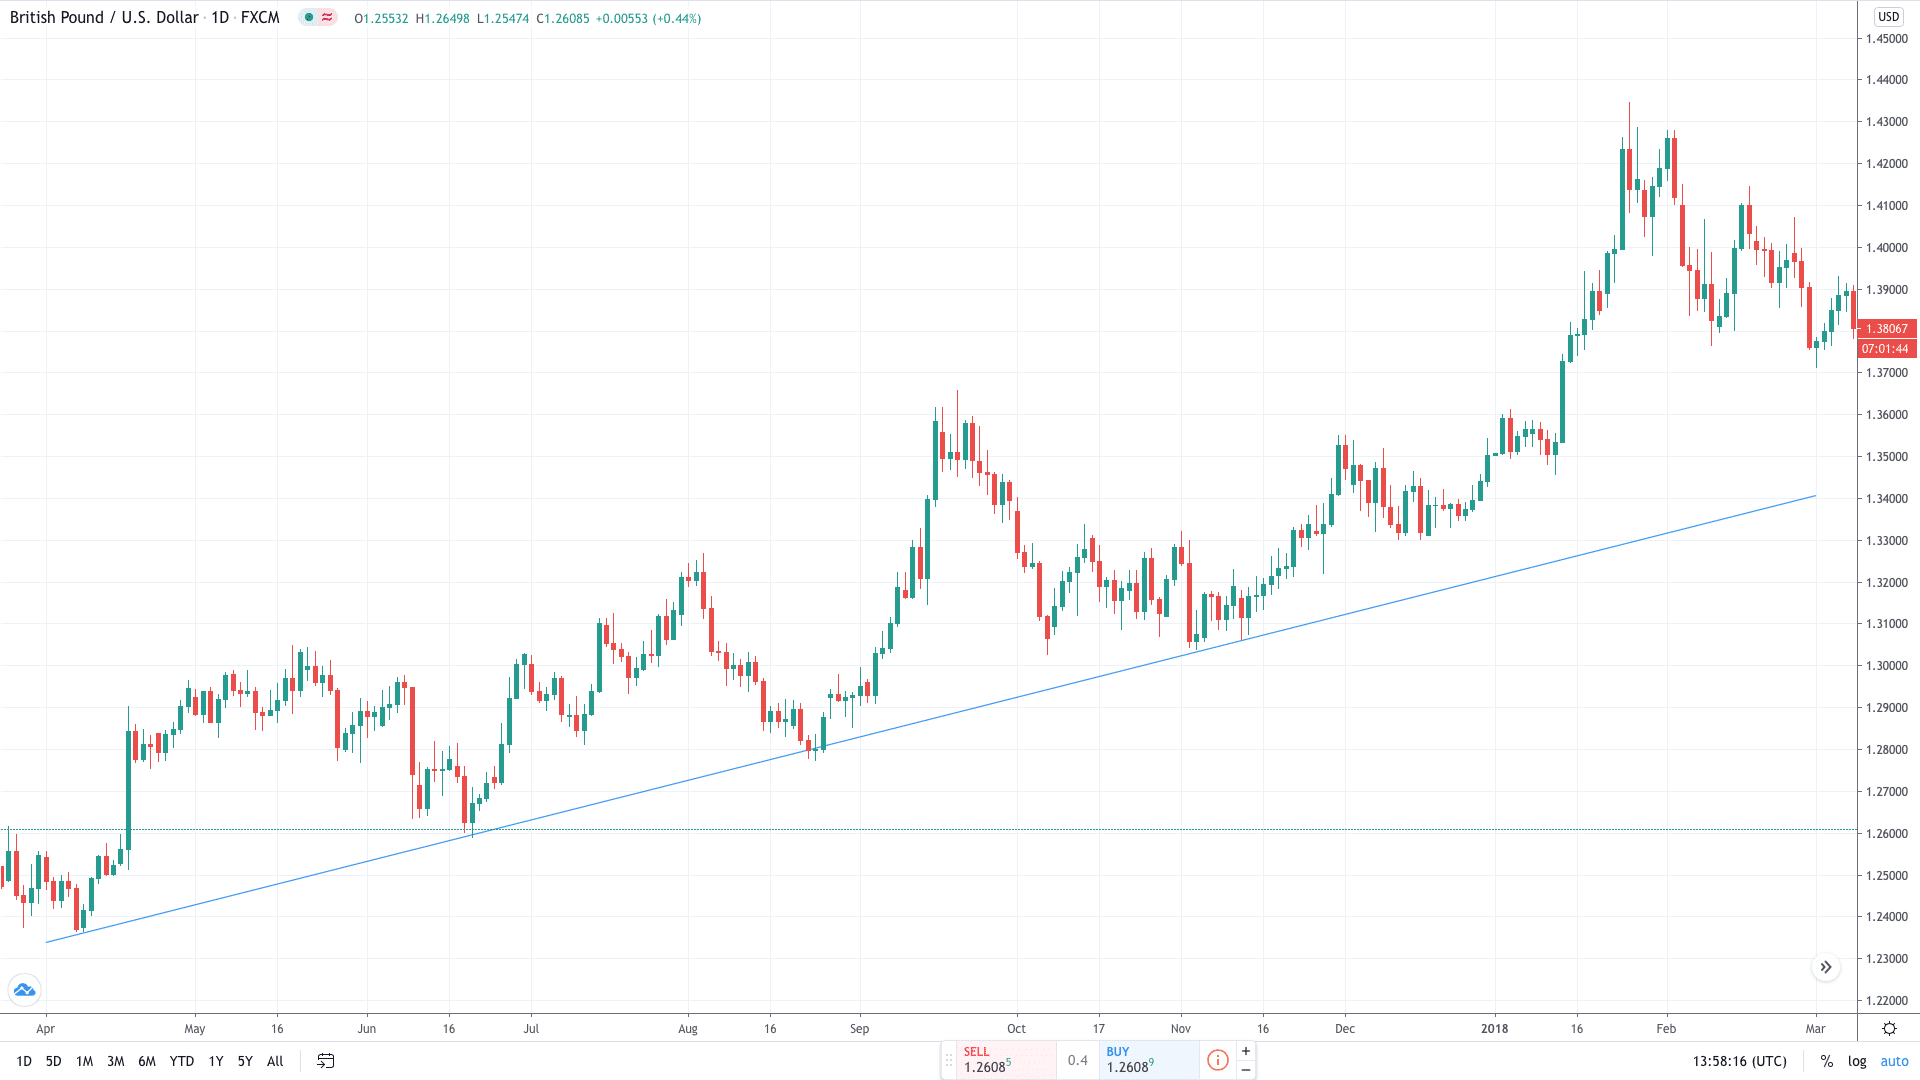
In a GBP/USD daily chart we see an ascending trend line that connects at least four swing lows. Therefore, we conclude that the currency pair is trading in an uptrend as it produces higher lows. Again, the more times the price reaches a trendline, the stronger the trend is.
Channels, on the other hand, are made of two parallel trend lines. In general, we make a distinction between the horizontal (a rectangle), ascending, and descending channels. It is important to allow for minor deviations with trend lines as price may slightly move below or above the trend line.
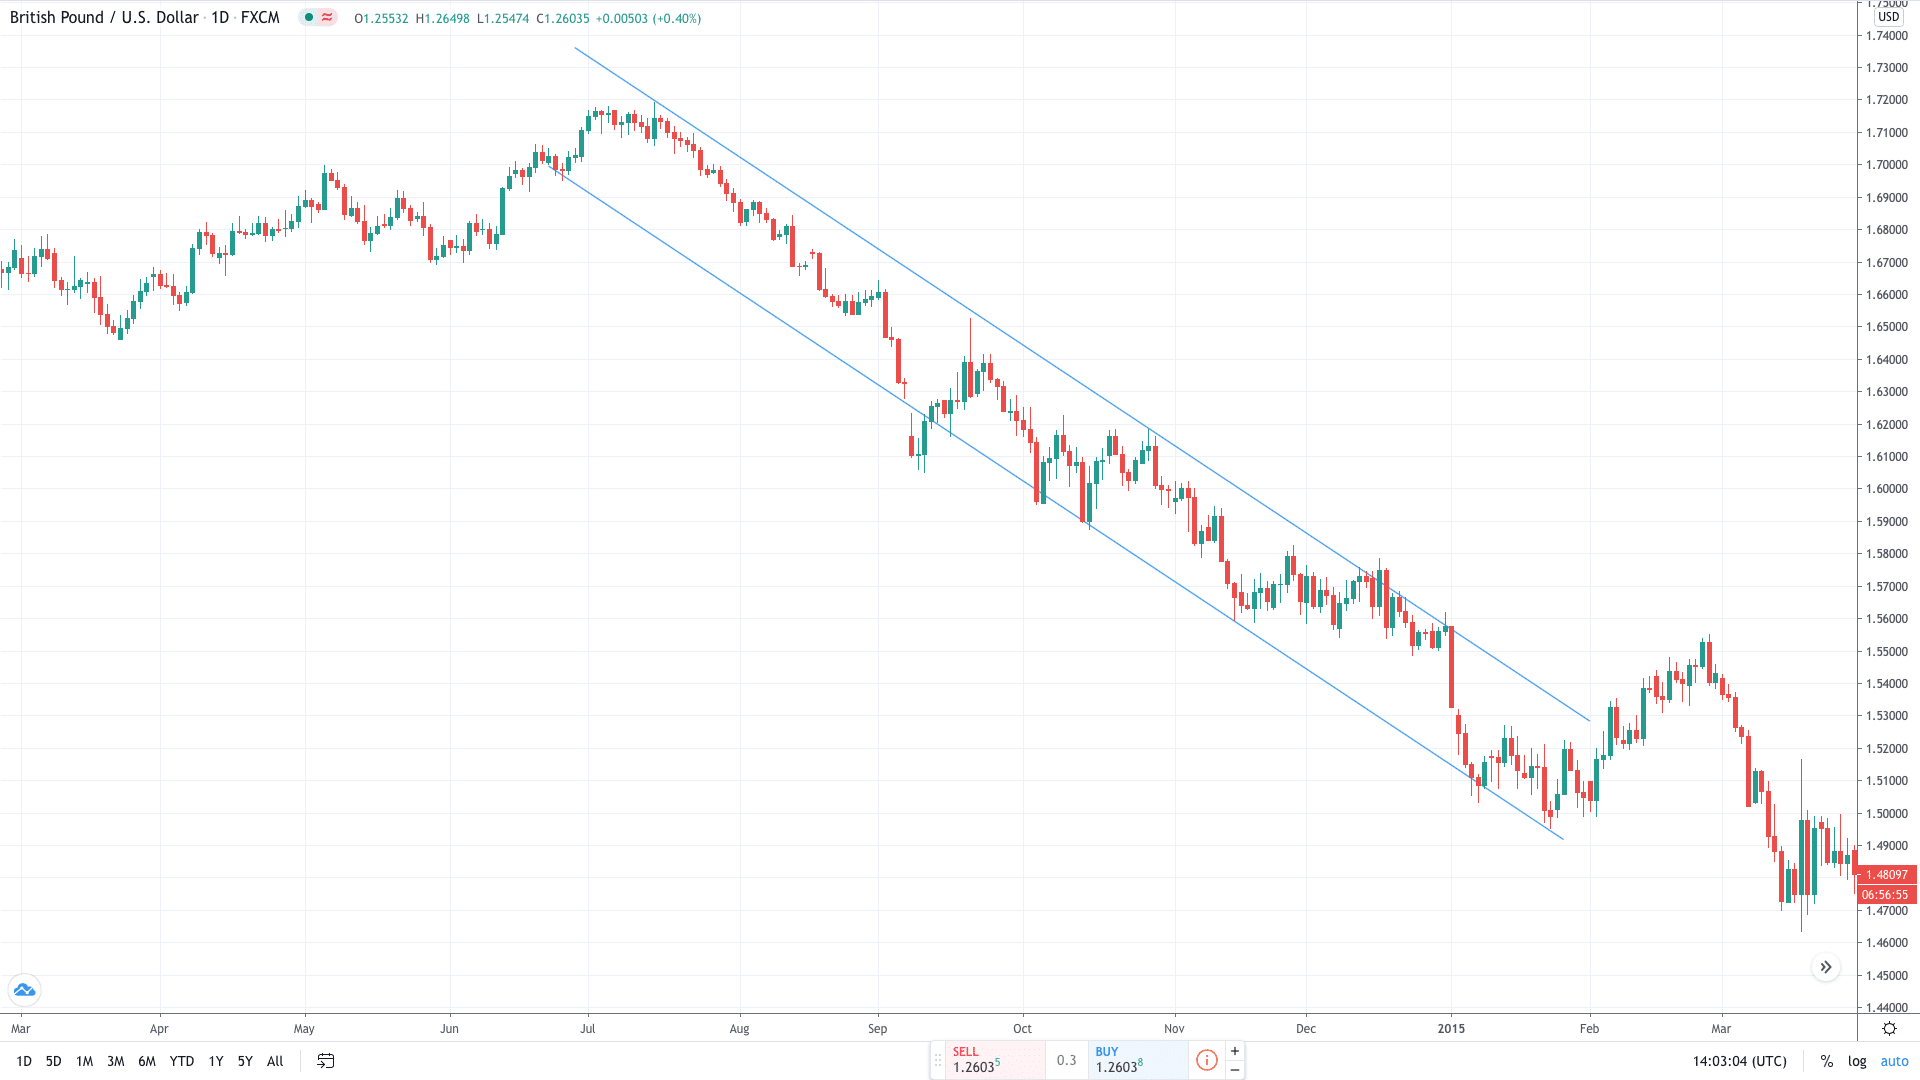
In this example, we see the pound moving lower in the form of a descending parallel channel. This is quite an aggressive move as there is practically no correction over the course of a downtrend.
Moving Averages
The moving average (MA) is arguably the most commonly used technical indicator. It calculates the average price of an asset over the specified period (e.g. 100 last periods). The two most popular types of moving average are the simple moving average (SMA) and the exponential moving average (EMA).
Traders apply moving averages on a chart as the price action tends to use it as support and resistance. This technical indicator is especially useful when applied in conjunction with other technical tools.
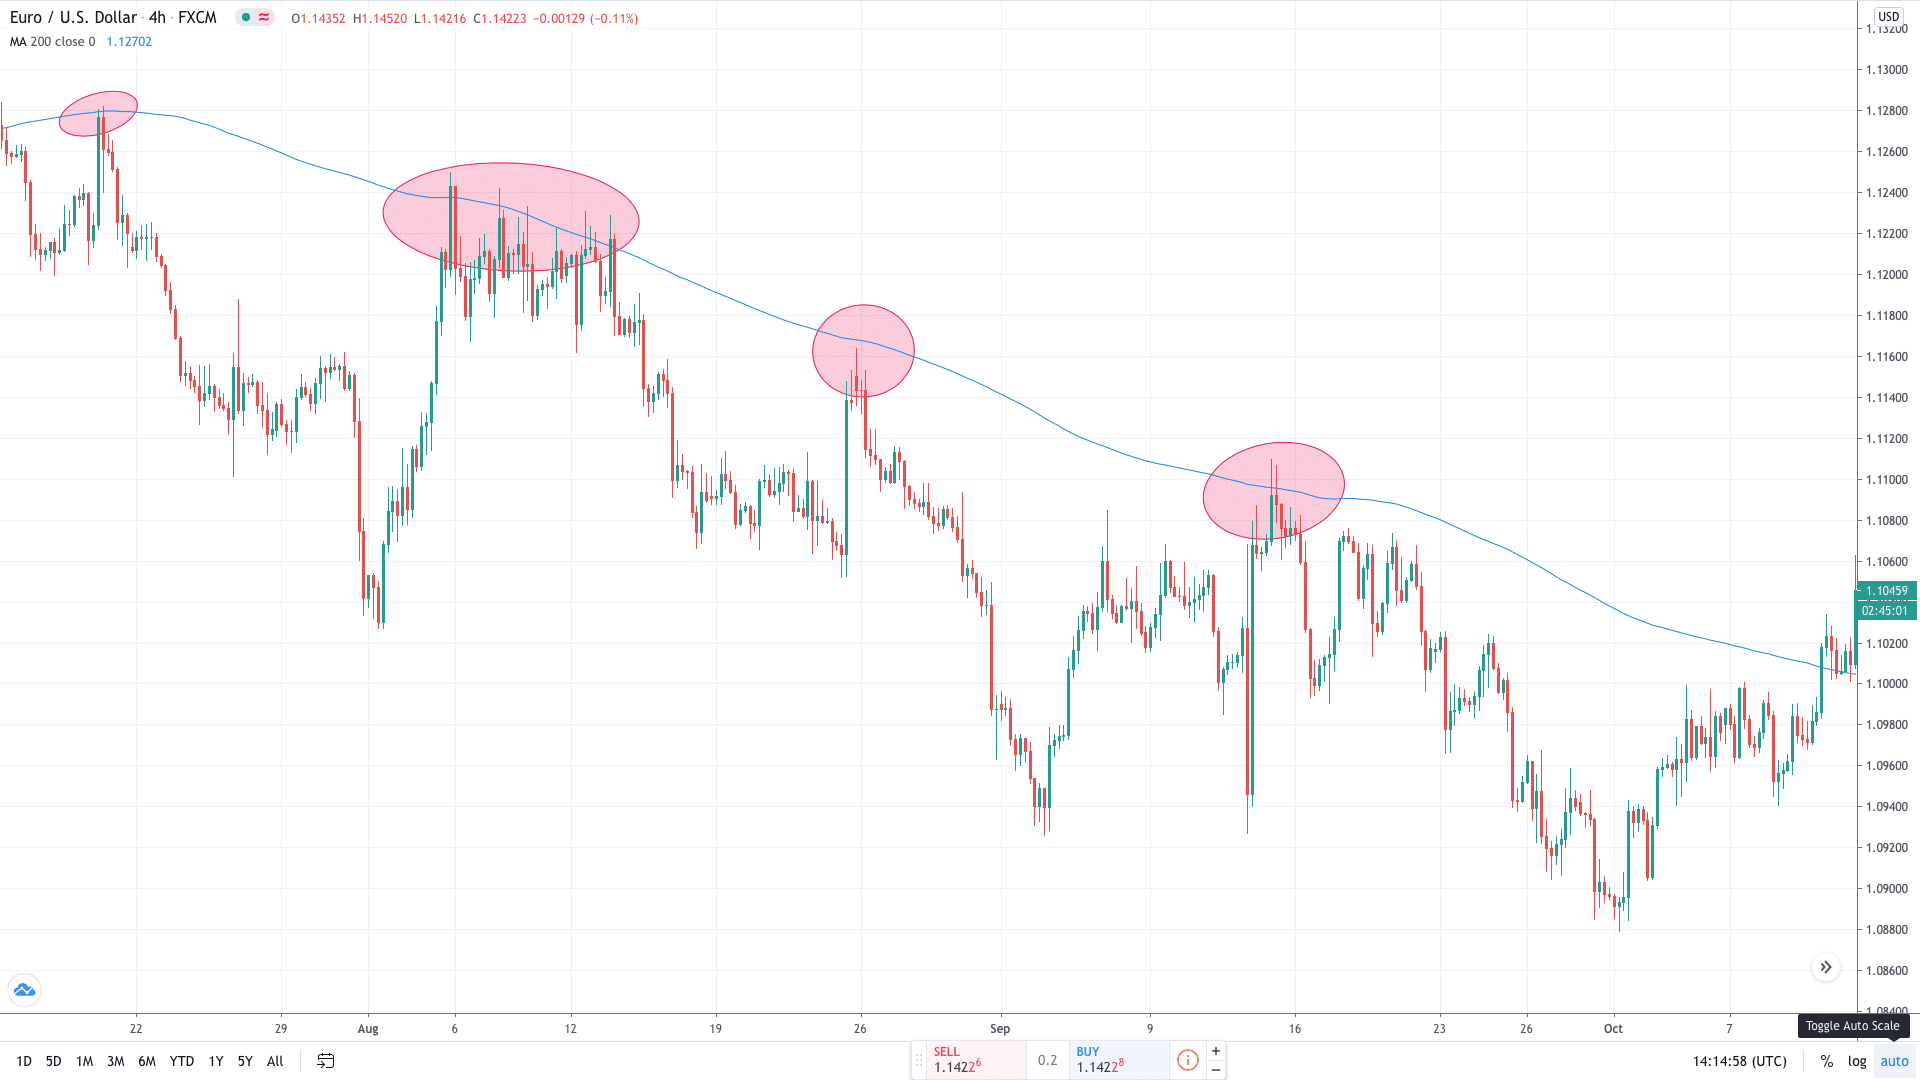
In the EUR/USD 4H chart we see the importance of the 200-SMA. The indicator helps the sellers to control the downtrend as multiple attempts to reach higher levels were capped by this moving average.
Swing levels
As the price action moves higher and lower in waves, the swing high refers to the peak prices in the waves before it retreats back again. On the other hand, a swing low refers to the bottoming out of the price in the waves before it climbs back up again.
Swing highs and lows can be found on the price chart without the need for any tools or indicators. Mark the closest highs and lows that previously occurred. You should search for lows and highs that are close to the price it is registering at that moment. When you see that the price has reversed from this level significantly, you can mark these price points as strong levels.
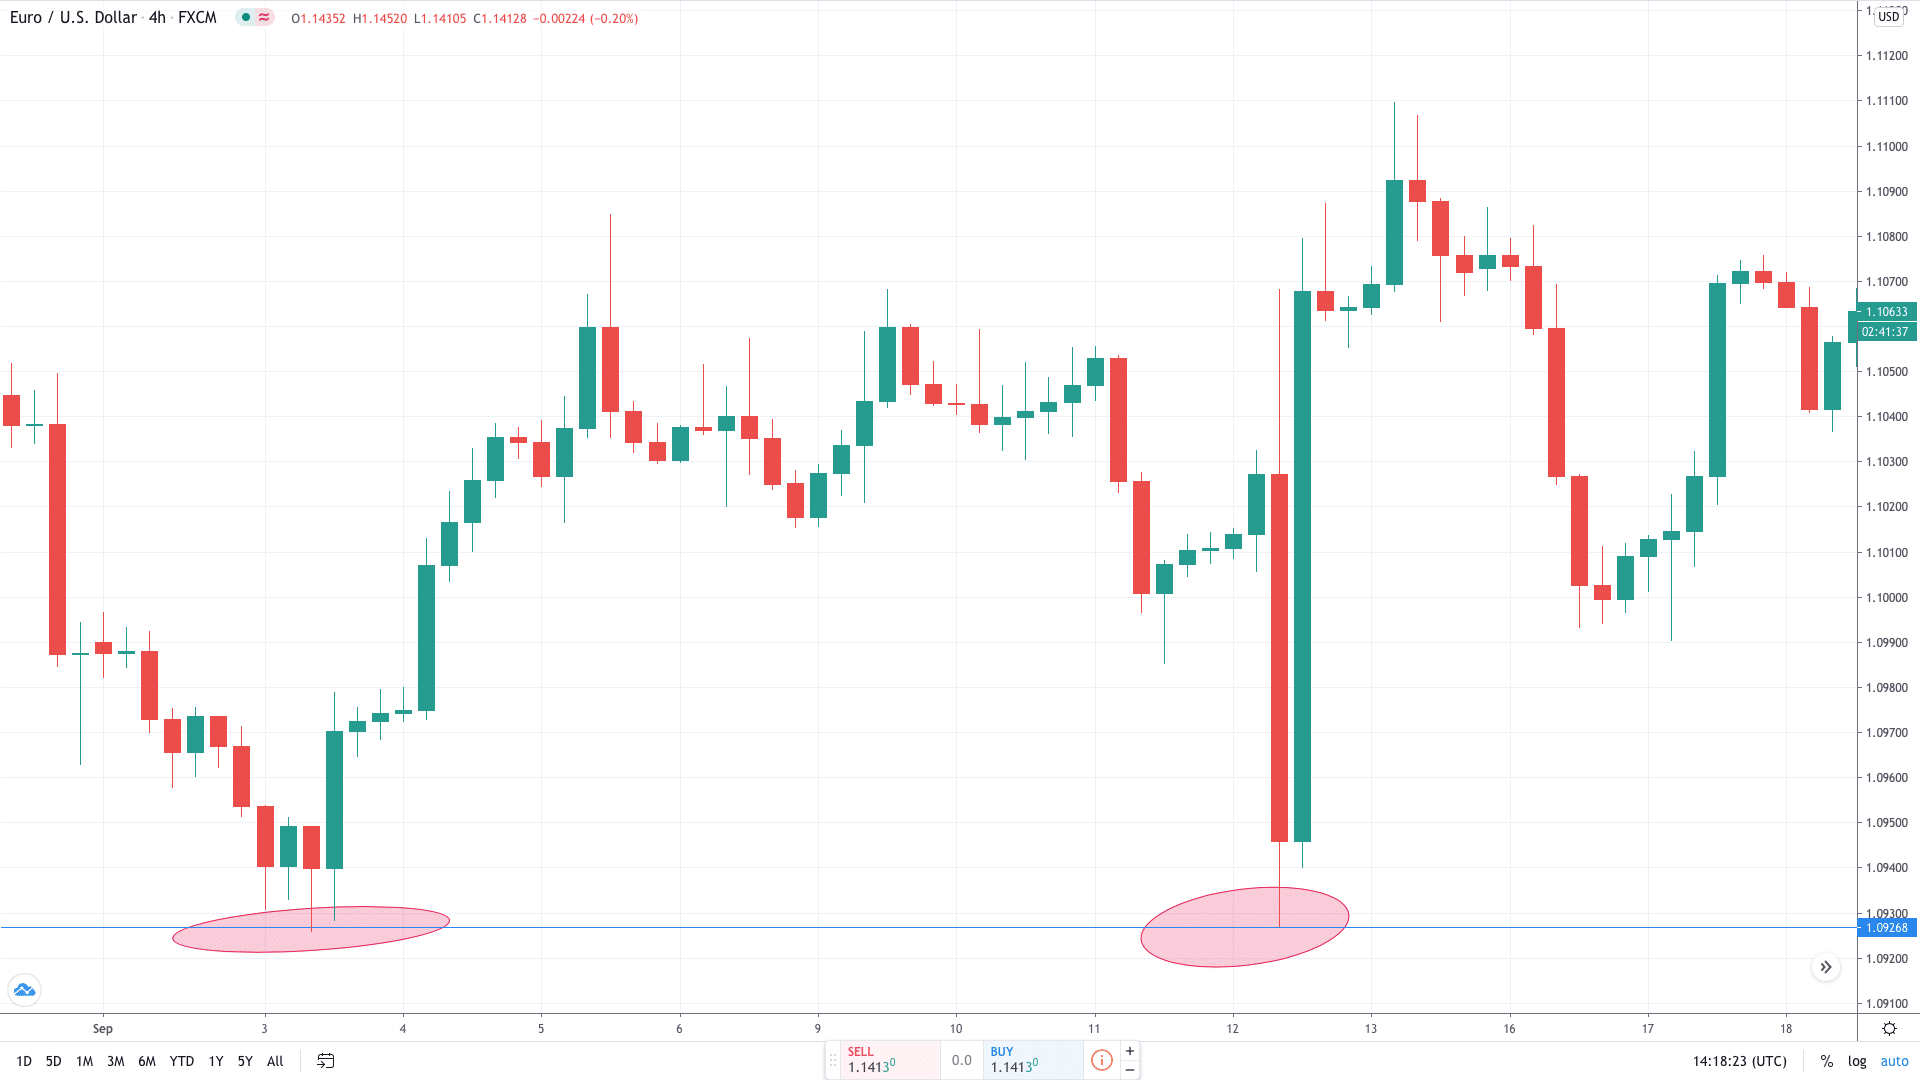
Two similar swing lows in EUR/USD 4H chart help us to determine the horizontal support. By simply drawing a horizontal line where the first low ended, we predict a similar bounce when the price touches it next time.
How To Trade Support And Resistance Levels
We will not demonstrate how to trade support and resistance levels. In this particular case, we use trend lines to profit from the price action hitting the support zone. We proceeded to draw the trend line by connecting two rising swing lows.
As the trend line is in place now, we are looking to capitalise on the 3rd touch. The entry point is placed a few pips above the trend line at $1.2800. The first exit point – a stop-loss order – sits around 50 below the trend line.
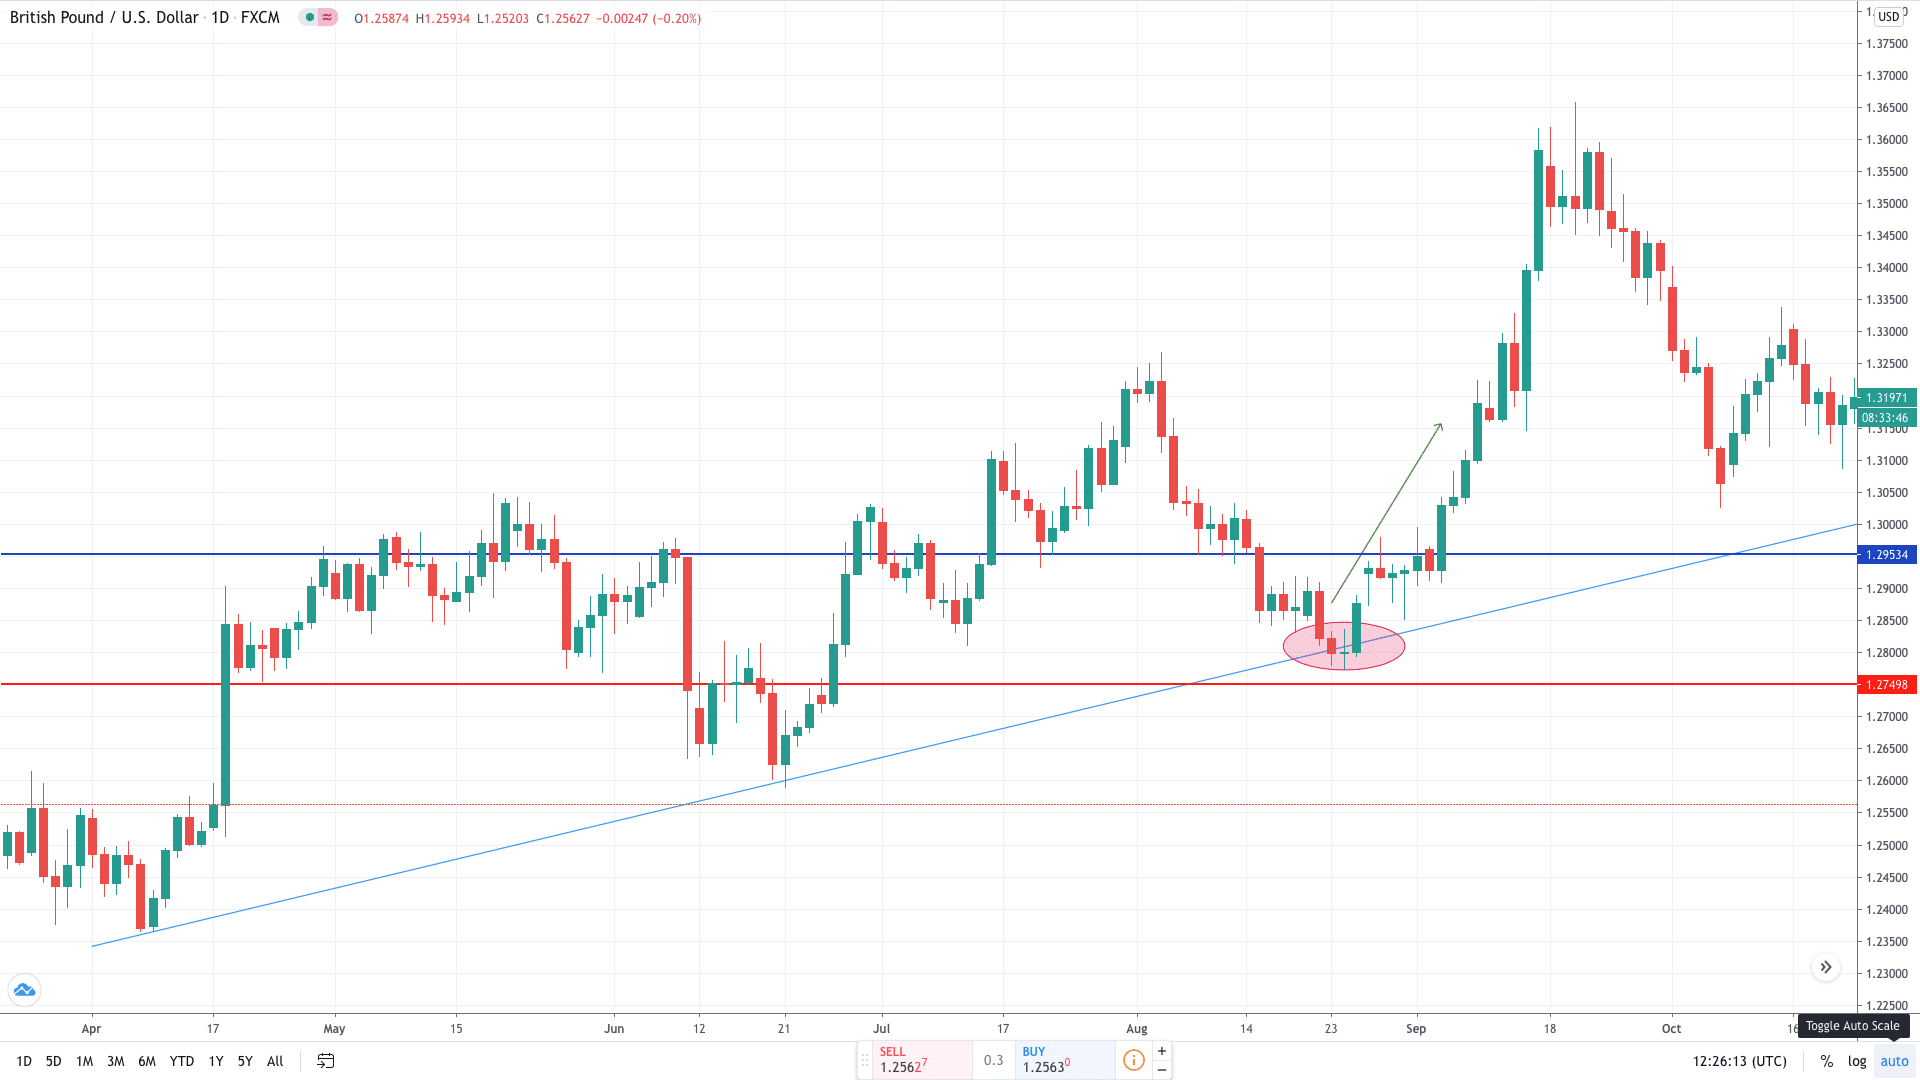
We use horizontal support and resistance levels that played a part in the past to identify a profit-taking level. Therefore, $1.2950 is a resistance level where we look to collect our profits. Ultimately, the price action hits our target to bring us profits equivalent to 150 pips.
Tips For Using Support And Resistance Levels
- Identify a time frame that suits your trading style. Lower time frames are more used by day traders and scalpers.
- Try to keep old support and resistance lines alive. Once the price action moves higher or below, don’t remove these lines. An old support level usually becomes new resistance after a break.
- Try placing your entry order a few pips above/below support and resistance levels. The price action sometimes reacts from a zone of interest without touching the exact level in a pip.
- Focus first on basic technical tools – horizontal and diagonal trend lines, pivot points and moving average.
Summary
Support and resistance levels are the most commonly used technical tools within a trading community. It’s a basic and fundamental concept used to find levels of interest, manage high risk and place stops, and identify appropriate entry and exit positions.
PEOPLE WHO READ THIS ALSO VIEWED: