
For many traders, the idea of looking at a pivot point formula for trading might seem overly complicated or just difficult to understand. However, the math behind these formulas is relatively basic and having some knowledge of these calculations can give traders a better sense of which pivot point indicator is the best choice for any individual trading style.
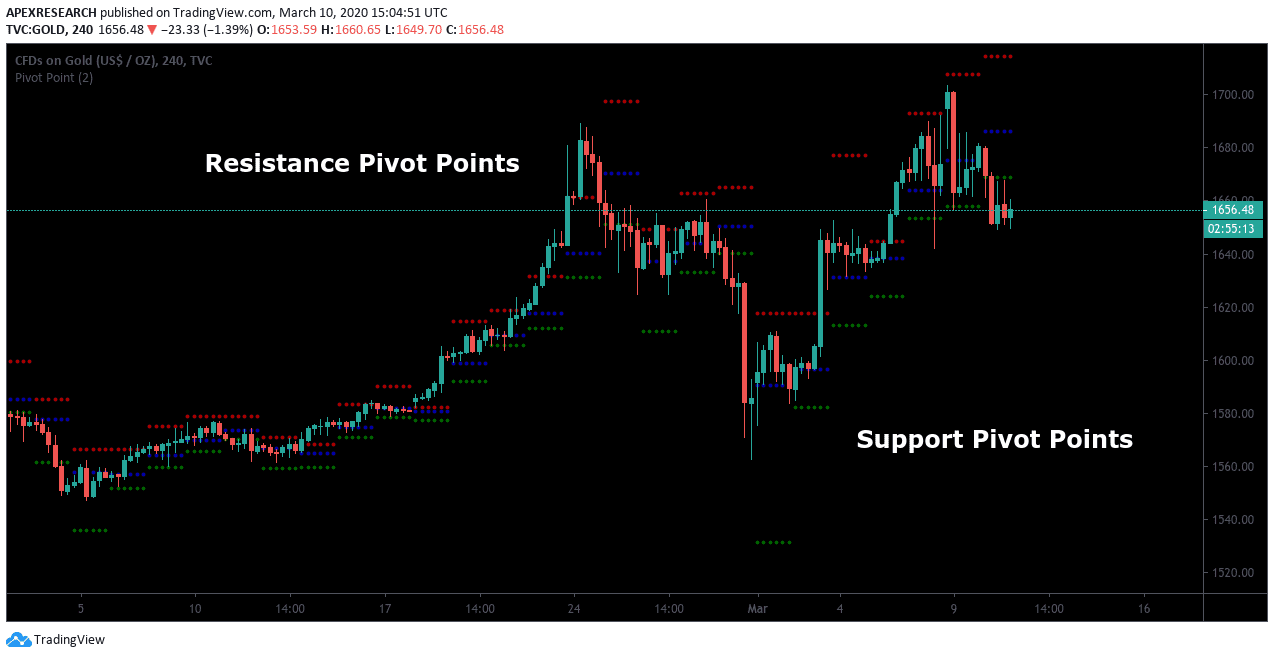
How to Calculate Standard Pivot Points
Standard Pivot Points allow traders to plot support and resistance levels around a central pivot that is determined by a series of simple calculations. The central price pivot takes the sum of the price high, the price low, and the closing price of whichever time period is selected in a trader’s charting station. This total sum is then divided by a factor of three and this figure forms the basis of the pivot point indicator readings. Specifically, the formula that determines price levels for Standard Pivot Points is as follows:
Resistance 1 (R1) = (Pivot Point x 2) – Low
Resistance 2 (R2) = Pivot Point + (High – Low)
Pivot Point = (High+Low+Price Close) / 3
Support 1 (S1) = (Pivot Point x 2) – High
Support 2 (S2) = Pivot Point – (High – Low)
On most modern trading stations, Standard Pivot Point levels can be identified using the common color schemes. Resistance lines are usually plotted in a one color, while support lines will be plotted using another. In contrast, the central pivot line is often plotted using a black color, and this line forms the basis of developing the system’s trading range.
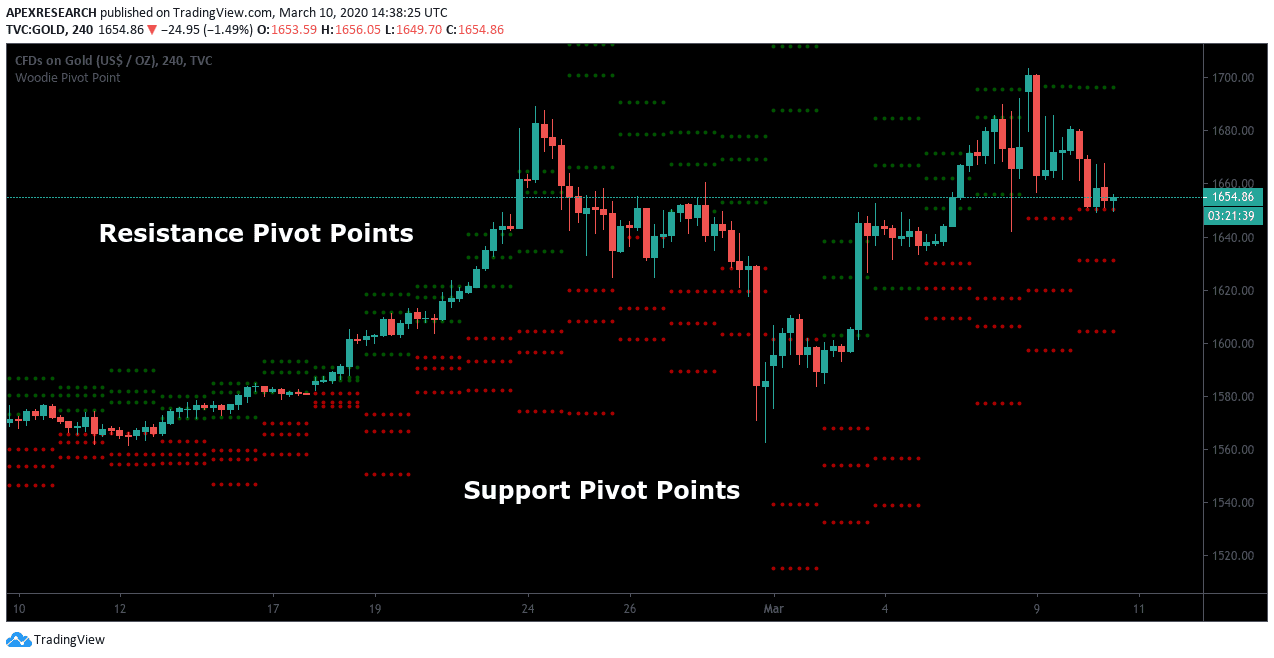
How to Calculate Woodies Pivot Points
Woodies Pivot Points also allow traders to plot two pivot support and resistance levels, based on a central pivot. Under the system, this central pivot places the first resistance level at a price point that’s 2x the Pivot Point minus the price lows. Finally, the price boundary that results is plotted using the sum of the Pivot Point and the difference between the price high and price low of the charting period. On most trading stations, the formula that determines price levels for the Woodies Pivot Points indicator can be read as follows:
R2 = Pivot Point + (High–Low)
R1 = (2x Pivot Point) – Low Pivot Point = (High+Low) + (2x Closing Price) / 4
S1 = (2x Pivot Point) – High
S2 = Pivot Point – (High+Low)
The pivot calculation that is used for the Woodies pivots systems are often described as being quite different from the formula that determines levels for Standard Pivot Points. In this respect, a primary difference lies in the fact that the formula for the Woodies system places additional weight on an asset’s closing price activity. Here, astute traders might notice that calculations for certain pivots will require us to multiple closing prices by a factor of 2x before adding sum totals for the price high and price low.
As a result, this system works in ways that are similar to strategies that involve the use of Exponential Moving Averages (EMAs) because price data that is recent will be weighted most heavily (in relation to earlier price data). It’s also important to note that in some asset markets (i.e. foreign exchange markets), opening prices and closing prices for a certain asset might actually be the same value. In most cases, this can happen when a trading broker operates on a 24-hour basis and doesn’t record a difference between prices that post on consecutive trading days.
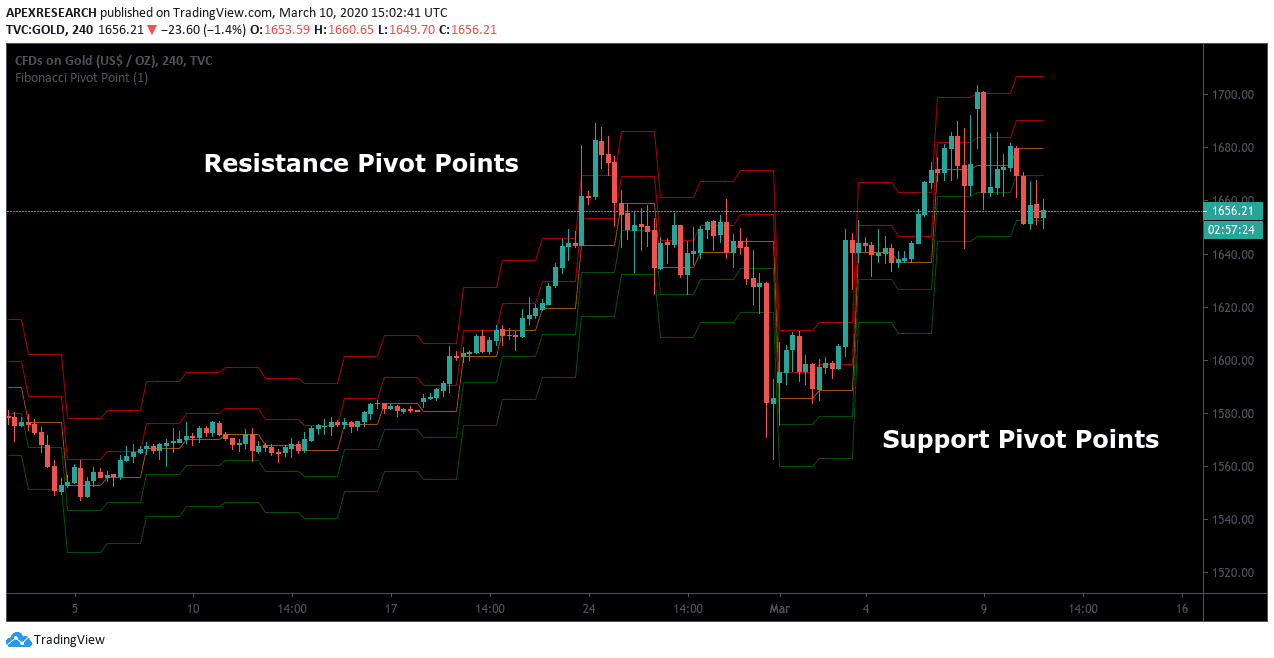
How to Calculate Fibonacci Pivot Points
Fibonacci numbers are regularly used in modern portfolio strategies for investments, and this type of analysis can be applied for those individuals that are using pivot points for day trading, as well. On trading station software applications, traders can easily find tools allowing access to popular trading platforms like Fibonacci pivot indicator mt4. Fortunately, these trading programs make it easier for investors to find economic indicator studies related to Fibonacci retracements, projections, and extensions. Interestingly, these tools are often employed by people that trade in the Forex market or in cryptocurrencies. However, these tools can also be quite effective in commodities markets and stock markets, as well.
Primary price levels in Fibonacci pivot formulas are typically associated with the Fibonacci numbers at the 38.2% and 61.8% retracement levels. These trading tendencies often force investors to monitor these retracement levels quite closely whenever trades have a chance to reach profitability based on the system projections. One strategy that is actively used in the market is to view important Fibonacci pivot point indicator readings in combination with price patterns (such as a triangle pattern or head and shoulders pattern). Price patterns that work in conjunction with pivot point price levels are often viewed as strong market signals. Traders can view these Fibonacci Pivot Point levels in ways that are similar to Standard Pivot Point levels and the Fibonacci Pivot Point formula is as follows:
Resistance 1 = (0.382 x (High–Low)) + Pivot Point
Resistance 2 = (0.618 x (High–Low)) + Pivot Point
Resistance 3 = (1.0 x (High–Low)) + Pivot Point
Pivot Point = (High+Low+Close) / 3
Support 3 = Pivot Point – (1.0 x (High–Low))
Support 2 = Pivot Point – (0.618 x (High–Low))
Support 1 = Pivot Point – (0.382 x (High–Low))
When traders are monitoring Fibonacci pivot indicator levels, it’s often a good idea to view the central pivot level as a starting point and watch for new trend direction in relation to yesterday’s price values. Traders can simply multiply the range values from the prior trading day by any known Fibonacci ratio (usually 38.2% or 61.8%). Finally, expert traders are able to define and modify a trading stance after adding the results from these calculations to the pivot point value (when identifying resistance levels) or subtracting the figure from the pivot point value (when identifying support levels). In combination, these techniques allow traders to initiate a trading stance that is clearly defined as either bullish or bearish.
How to Calculate DeMark Pivot Points
Tom Demark introduced the Demark Pivot Points to the financial markets as a response to the prior work in the discipline that was conducted by J. Welles Wilder. In contrast, DeMark’s unique take on the traditional concepts of pivot point for swing trading was based on decades of active trading and analysis of historical backtesting studies. Demark Pivot Points are conditional in nature because they are based on differential relationships that exist between the opening market price of an asset and the closing price of an asset:
Pivot Point Value = X / 4
Resistance 1 = (X / 2) – Price Low
Support 1 = (X / 2) – Price High
When the Closing Price > Opening Price:
X = (Price High x 2) + Price Low + Closing Price
When the Closing < Opening Price:
X = High + (Price Low x 2) + Price Close
When Closing = Opening Price:
X = Price High + Price Low + (Closing Price x 2)
Demark Pivot Points give us another example of an exponential trading system which places greater emphasis on price activity that is most recent. Many traders that consistently use Demark Pivot Points will also use DeMark’s TD Line trend following system in order to find support and resistance levels during intraday market periods.
Useful Pages
Conclusion
Historical backtesting results suggest market trading ranges typically characterize market price action and this means day trading pivot points can make it easier to structure trades in live brokerage platforms. Additionally, mastering pivot points can help traders find levels to place stop-loss orders and these protective techniques are often placed outside of external support or resistance zones. In cases where market price activity continues to move beyond these important pivot zones, traders might instead opt to implement a “stop and reverse” strategy. In other words, prior long positions can be closed so that new short positions can be established. Similarly, prior short positions can be closed in cases where new long positions should be established for the same financial market asset.
PEOPLE WHO READ THIS ALSO VIEWED:


