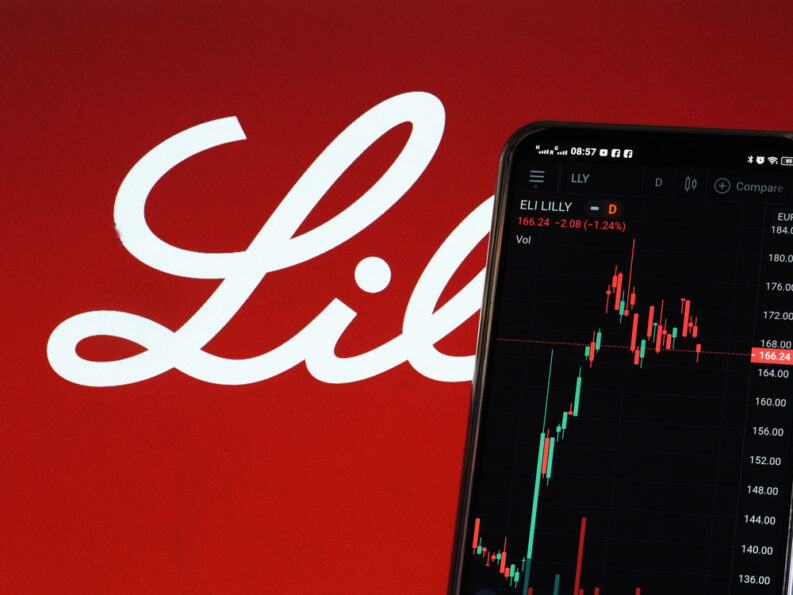
Eli Lilly and Company Stock (NYSE: LLY) shares have taken shareholders on quite the ride in the last 12 months. Trading between highs of $972.53 and lows of $677.09. The share price has fallen -13.99% in the last year, and has appeared to have levelled out since the beginning of the year.
The share price rollercoaster has had its ups and downs, and has been affected by some not so positive news. The European Medicines Agency’s Committee for Medicinal Products for Human Use recommended against the marketing approval of Lilly’s Alzheimer’s drug, Kisunla, citing concerns over potential risks of brain swelling and bleeding.
This decision represents a significant setback for Lilly in the European market, despite approvals in the U.S., Japan, and China. The regulatory landscape for Alzheimer’s drugs is particularly challenging, given the complexity of the disease and the potential for adverse side effects.
Furthermore, in October 2024, Lilly reported third-quarter earnings that fell short of expectations, primarily due to lower-than-anticipated sales of Zepbound and Mounjaro. This resulted in a reduction of the company’s full-year adjusted profit guidance and a subsequent 10% drop in its stock price.
This highlights the inherent risks associated with pharmaceutical investments, where sales can be volatile and influenced by a variety of factors, including competition, pricing pressures, and regulatory changes.
Eli Lilly and Company Share Price Targets
Analysts have set a 12-month price target for Eli Lilly with an average expectation of $993.37, ranging from a high of $1,250.00 to a low of $580.00.
The current consensus average target suggests a potential increase of 27.66% from the most recent trading price.
Our View: You would be wise to consider the views of the analyst community in conjunction with the fundamentals surrounding the company to properly determine a value for the stock that you feel is appropriate.
At the upper end of analysts estimates it would be easy to get carried away with the potential gains on show, but the flipside is that these targets can shift within the blink of an eye and that the view of analysts is very dynamic.
If you are considering swing trading, or day trading Eli Lilly shares that is a separate consideration, but for those planning for the long haul, fundamental analysis is king.
Eli Lilly and Company – The Basics Driving The Business
Eli Lilly, a global pharmaceutical giant, is making groundbreaking advancements in obesity and diabetes treatments with regulatory setbacks and the inherent volatility of the pharmaceutical market. Over the past year, the company has been a whirlwind of activity, marked by promising clinical trial results, strategic partnerships, significant manufacturing expansions, and, at times, disappointing financial performance.
Lilly’s core business revolves around the discovery, development, manufacturing, and marketing of pharmaceutical products across a wide range of therapeutic areas. These include diabetes, obesity, oncology, immunology, neuroscience, and cardiovascular diseases.
The company operates on a global scale, with a significant presence in North America, Europe, and Asia. Its success is driven by a robust research and development pipeline, a commitment to innovation, and a strong commercial infrastructure. The recent spotlight has primarily focused on its diabetes and weight-loss drugs, Mounjaro and Zepbound.
The most significant recent development is the promising early-stage trial results for eloralintide, an experimental obesity drug. Data released in June 2025 showed an average weight loss of 11.5% over 12 weeks. Eloralintide belongs to a new class of treatments mimicking the amylin hormone, which plays a crucial role in regulating digestion and suppressing appetite.
The potential combination of eloralintide with Lilly’s existing GLP-1 drug, tirzepatide (Zepbound), has generated considerable excitement, with analysts suggesting it could become the next generation of obesity treatment, solidifying Lilly’s dominance in this rapidly growing market. The potential market for such treatments is massive, with obesity rates climbing globally and a growing acceptance of pharmacological interventions.
Further bolstering its long-term prospects, Lilly has forged a strategic partnership with Purdue University, committing up to $250 million over eight years. This collaboration aims to leverage artificial intelligence and advanced technologies to accelerate pharmaceutical innovation across the drug discovery, development, and manufacturing processes. This investment underscores Lilly’s commitment to staying at the forefront of technological advancements in the pharmaceutical industry, potentially leading to more efficient and effective drug development.
To meet the surging demand for its diabetes and obesity medications, Lilly is undertaking a substantial $3 billion expansion of its manufacturing facility in Kenosha County, Wisconsin. This expansion will add 750 highly skilled jobs and significantly increase the company’s production capacity for drugs like Mounjaro and Zepbound.
This investment is a clear indication of Lilly’s confidence in the continued growth of its diabetes and obesity franchises. In addition to this, Lilly is investing $1.8 billion to expand manufacturing capabilities in Ireland, further solidifying its global manufacturing network.