
What is the diamond bottom pattern?
The diamond bottom pattern is not a common formation but is considered a strong bullish reversal pattern amongst technical analysts. This bullish reversal pattern first expands from the left-hand side and then contracts into a narrower range, until price breaks out above the resistance line and completes the pattern.
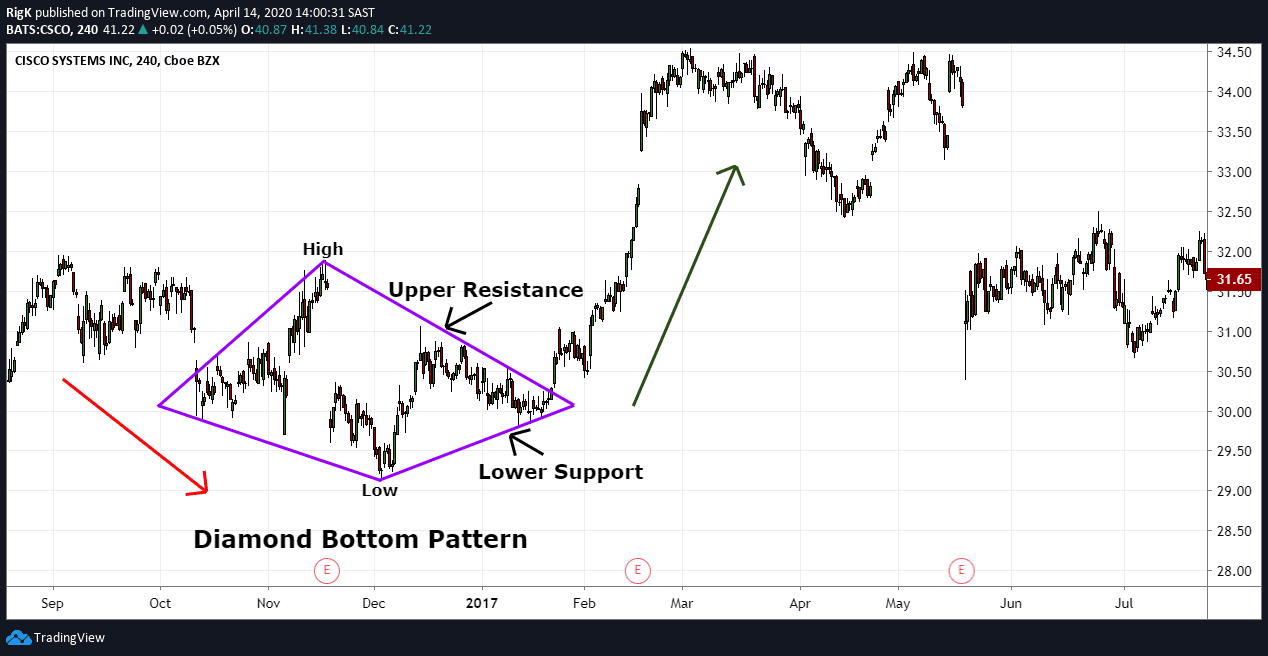
Image 1: Cisco Systems Inc on a 4-hour chart
With price first expanding and then contracting, analysts use trendlines to define this pattern which resembles the shape of a diamond, hence the name ‘diamond bottom’.
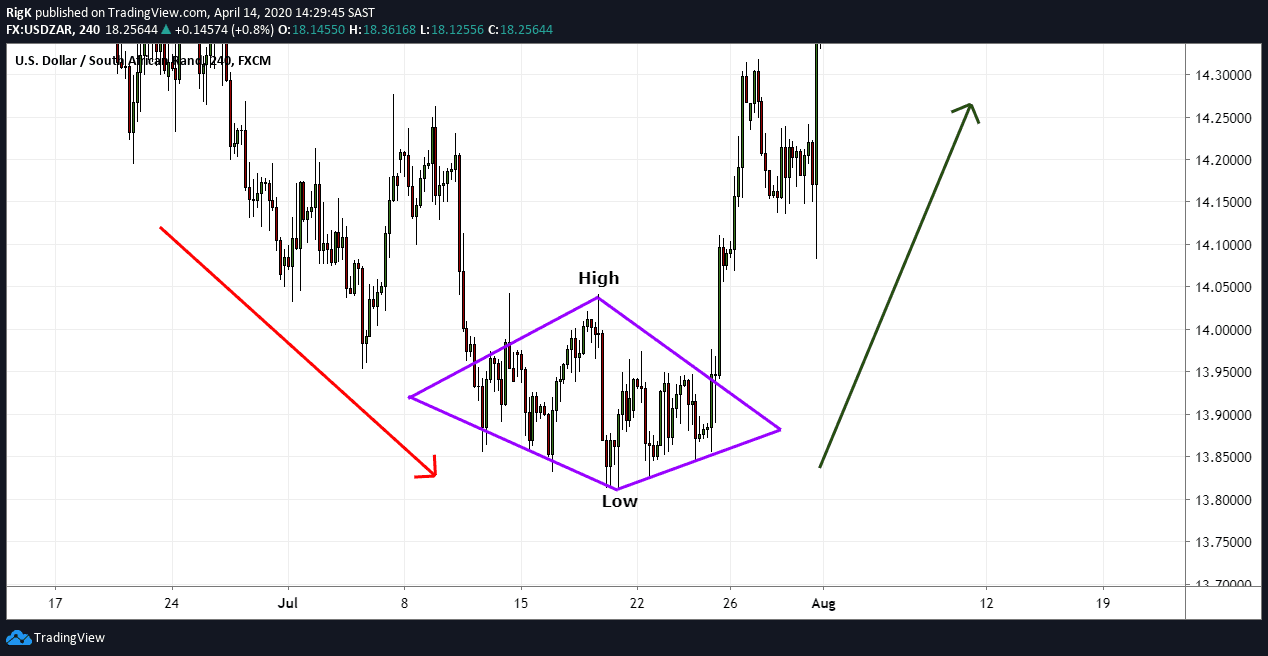
Image 2: USD/ZAR on a 4-Hour chart
Here we have another example of a diamond bottom that appeared at the end of a downtrend, followed by a strong reversal to the upside once the pattern completed. This is a great example of how explosive a move can be once the diamond pattern ends and is one of the reasons why technical traders like to trade this formation.
How to Trade the Diamond Bottom
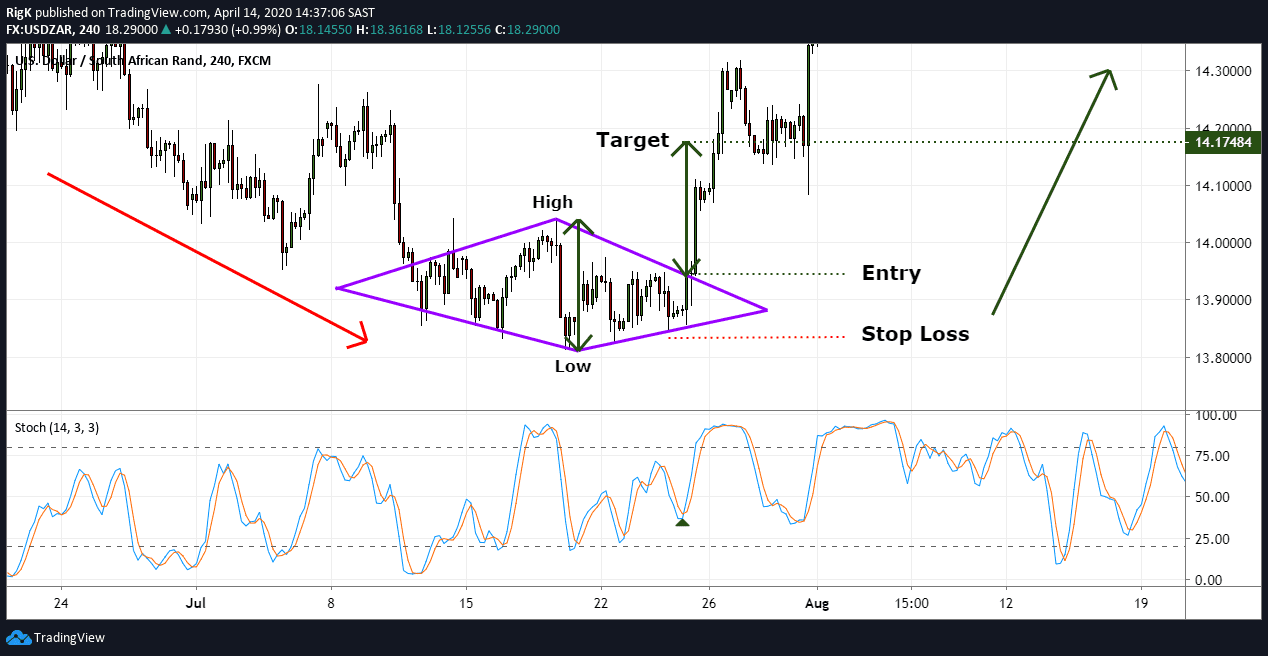
Image 3: USD/ZAR on a 4-Hour chart with Stochastic indicator
Using our previous diamond top pattern, traders will often execute a long position once price breaks above the upper trendline resistance and target a level equal to the height of the diamond formation.
A stop loss can generally be placed a few pips below the final swing low that occurred before the breakout.
Traders Tip: Like most chart patterns, it will always be a good idea to look for an additional confirmation signal before you enter a trade because this will raise the probability that the pattern is about to complete and increase your chances of price reaching your target.
One such confirmation tool is the stochastic oscillator which can indicate a shift in price momentum before a breakout. Note how the stochastic oscillator crossed to the upside prior to the breakout above the resistance line which resulted in price shooting higher, reaching the first target in quick succession.
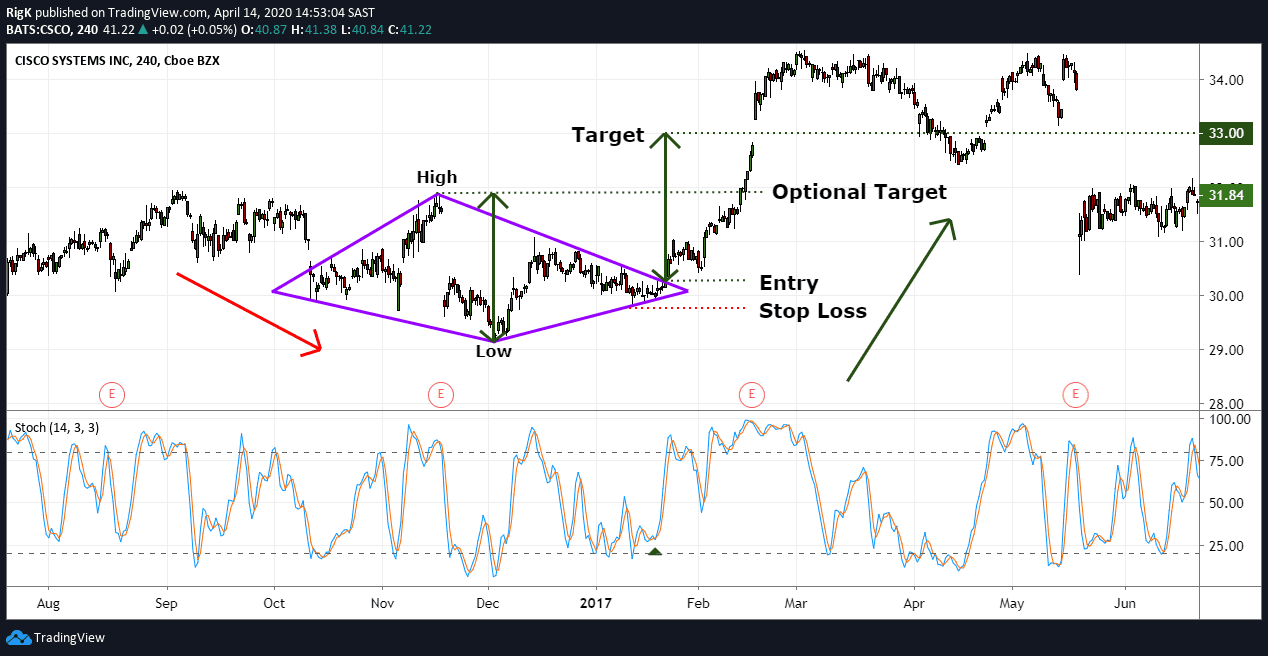
Image 4: Cisco Systems Inc on a 4-hour chart with Stochastic indicator
My final chart reverts to the first example of a diamond bottom pattern on the stock Cisco. This diamond bottom pattern formed at the end of a correction with additional confirmation from the stochastic oscillator prior to the breakout higher.
Note how fast price shot upward and have you traded this setup your stop loss would have been very tight, resulting in a great risk versus reward ratio.
Important: Your risk versus your reward potential is one of the most important factors to consider as a trader. The chart above shows that it was also possible to place an initial target at the high of the diamond pattern after the breakout, with a stop loss below the previous higher low.
This is an alternative way to set an initial target BUT it must make sense from a risk vs. reward standpoint.
Although not common, the diamond bottom pattern can lead to a high probability bullish reversal with a clearly defined target and stop loss level. Correctly identifying this pattern can result in large gains and is why you should consider trading it the next time you spot one.
PEOPLE WHO READ THIS ALSO VIEWED:
- Here are our latest trending stories
- Trade stocks with top-rated eToro
- Learn everything about Plus500 Withdrawal