
The Diamond Top Pattern Explained
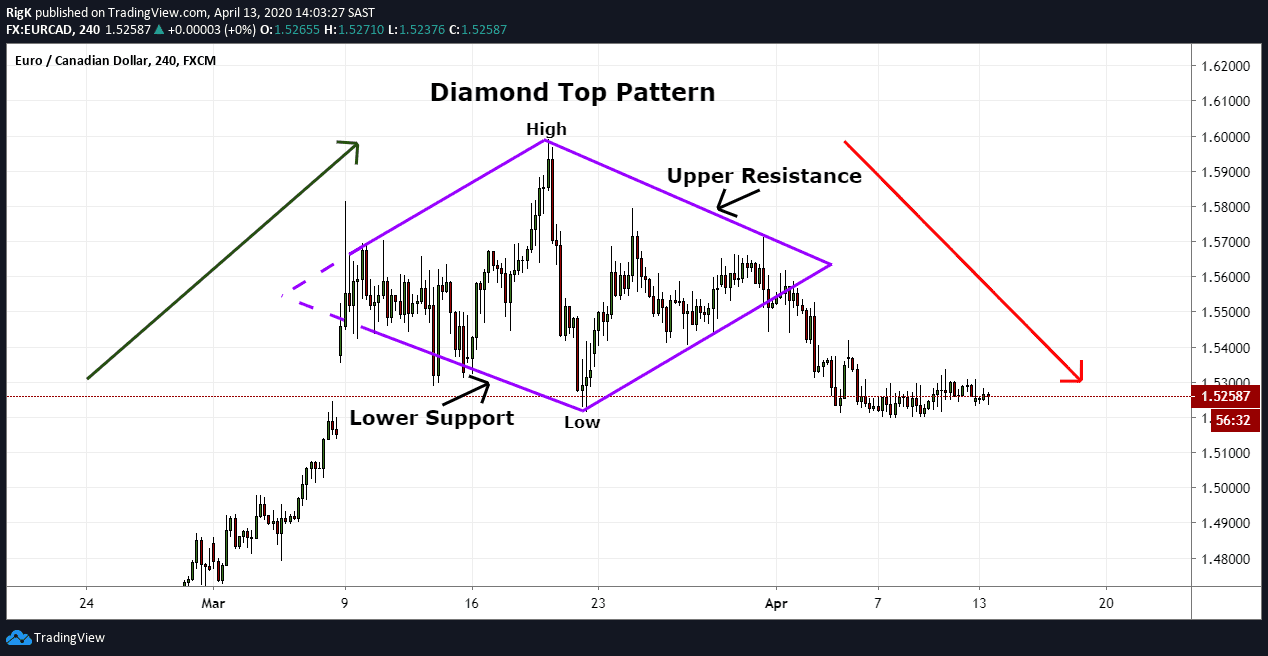
Image 1: EUR/USD on a 4-hour chart
The diamond top pattern is not a common formation but is considered a strong bearish reversal pattern amongst technical analysts. This bearish reversal pattern expands into a high and contracts after a low into a narrower range, until price breaks out below the support line and completes the pattern. With price first expanding and then contracting, analysts use trendlines to define this pattern which resembles the shape of a diamond, hence the name ‘diamond top’.
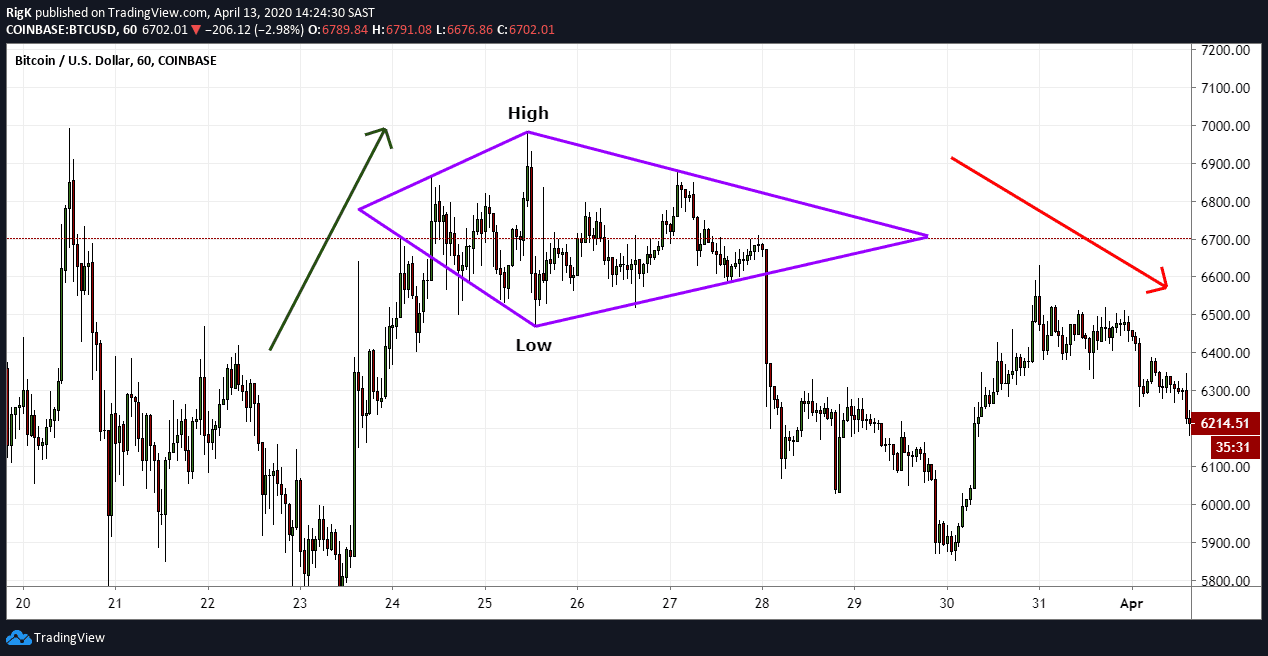
Image 2: BTC/USD on a 1-Hour chart
Here we have another example of a diamond top, but this time it appeared on a smaller timeframe and the right-hand side of the diamond was elongated. This is a great example of how explosive a move can be once the diamond pattern ends and is one of the reasons why technical traders like to trade this formation.
How to Trade the Diamond Top
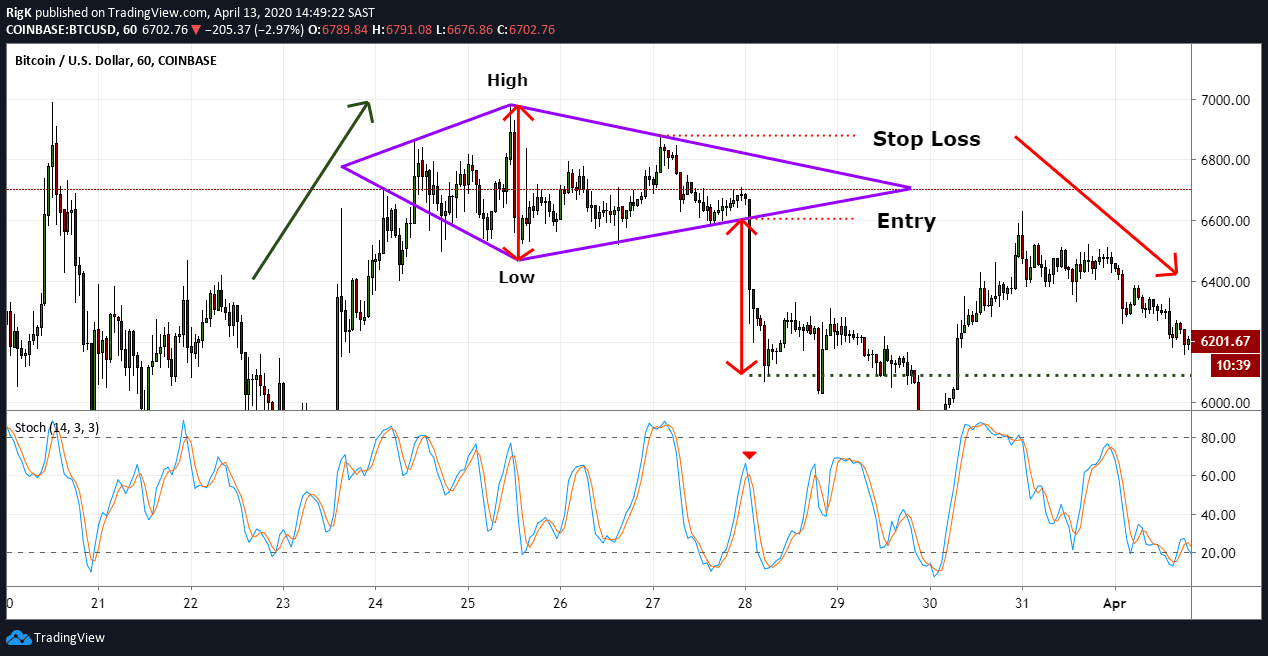
Image 3: BTC/USD with Stochastic indicator
Using our previous diamond top pattern, traders will often execute a short position once price breaks below the lower trendline support and target a level equal to the height of the diamond formation. A stop loss can generally be placed a few pips above the final swing high that occurred before the breakout.
Traders Tip: Like most chart patterns, it will always be a good idea to look for an additional confirmation signal before you enter a trade because this will raise the probability that the pattern is about to complete and increase your chances of price reaching your target.
One such confirmation tool is the stochastic oscillator which can indicate a shift in price momentum before a breakout. Note how the stochastic oscillator crossed prior to the breakout below the support line which resulted in price dropping lower and reaching the first target in quick succession.
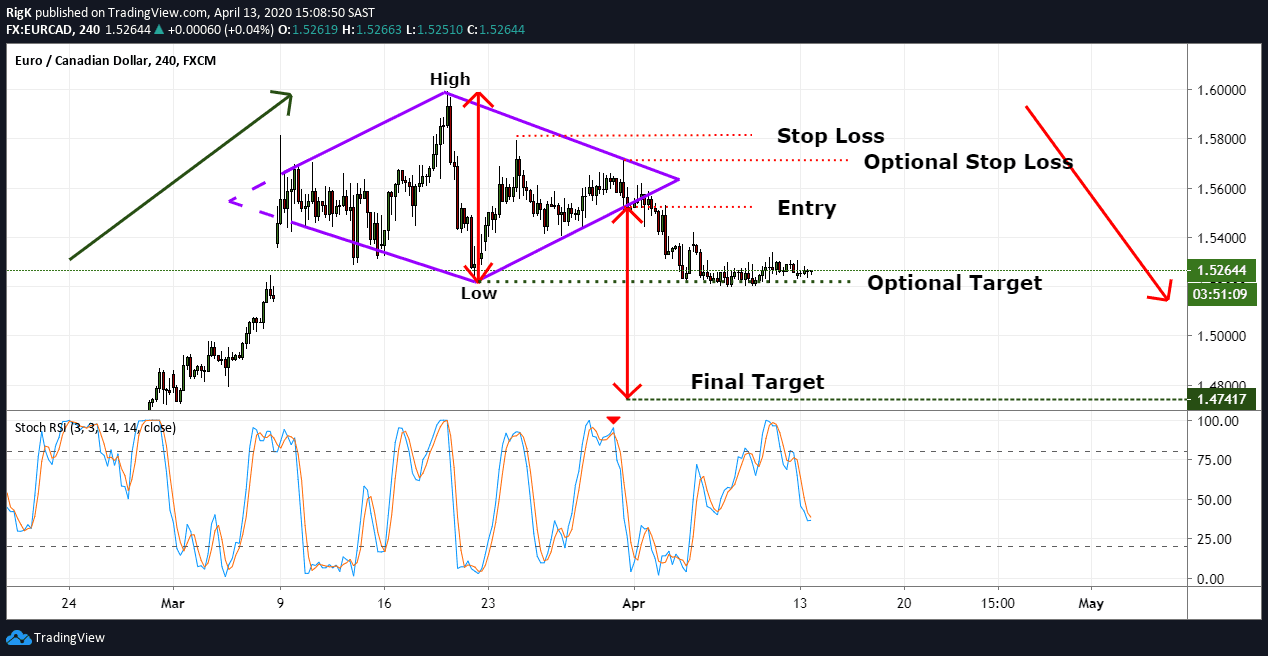
Image 4: EUR/USD with Stochastic indicator
My final chart reverts to the first example of a diamond top pattern on the EUR/CAD currency pair but note (at the time of writing) that price has not yet reached the lower target. There was however additional confirmation from the stochastic oscillator prior to the breakout lower and this will be a great example to follow in real-time to see whether the final target will eventually be obtained.
Important: Your risk versus your reward potential is one of the most important factors to consider as a trader. The chart above shows that it was possible to place an initial target at the low of the diamond pattern after the breakout, with a stop loss above the previous lower high. This is an alternative way to set an initial target BUT it must make sense from a risk vs. reward standpoint.
Although not common, the diamond top pattern can lead to a high probability bearish reversal with a clearly defined target and stop loss level. Correctly identifying this pattern can result in large gains and is why you should consider trading it the next time you spot one.
PEOPLE WHO READ THIS ALSO VIEWED: