What is the Vortex Indicator?
The Vortex Indicator is a technical analysis indicator that is primarily used to identify changes in trends (that is trend reversals) but can also be used to corroborate trends that are currently in place.
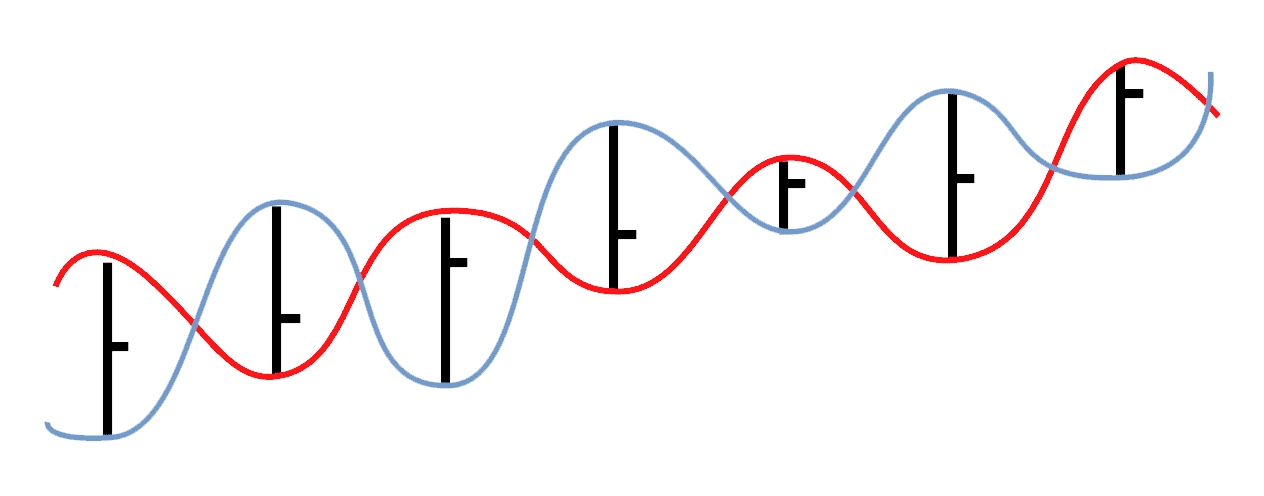
The vortex indicator is constructed from the highs and the lows from the last two trading periods (for example the past two trading days). The distance from the current period (day) high to the prior period (day) low signals a positive movement in trend. The measure between the current period low and the preceding period high defines a negative trend movement. This can be seen in Figure 1 below.
Figure 1
We will look at the detailed calculation of the Vortex Indicator below, but for now we will look at how we can profit from the indicator, by looking at Vortex Indicator trading strategies.
Example 1: Vortex Indicator Strategy
The Vortex Indicator can be used to give direct buy and sell signals and with a robust risk management strategy can generate winning trades and solid profits.
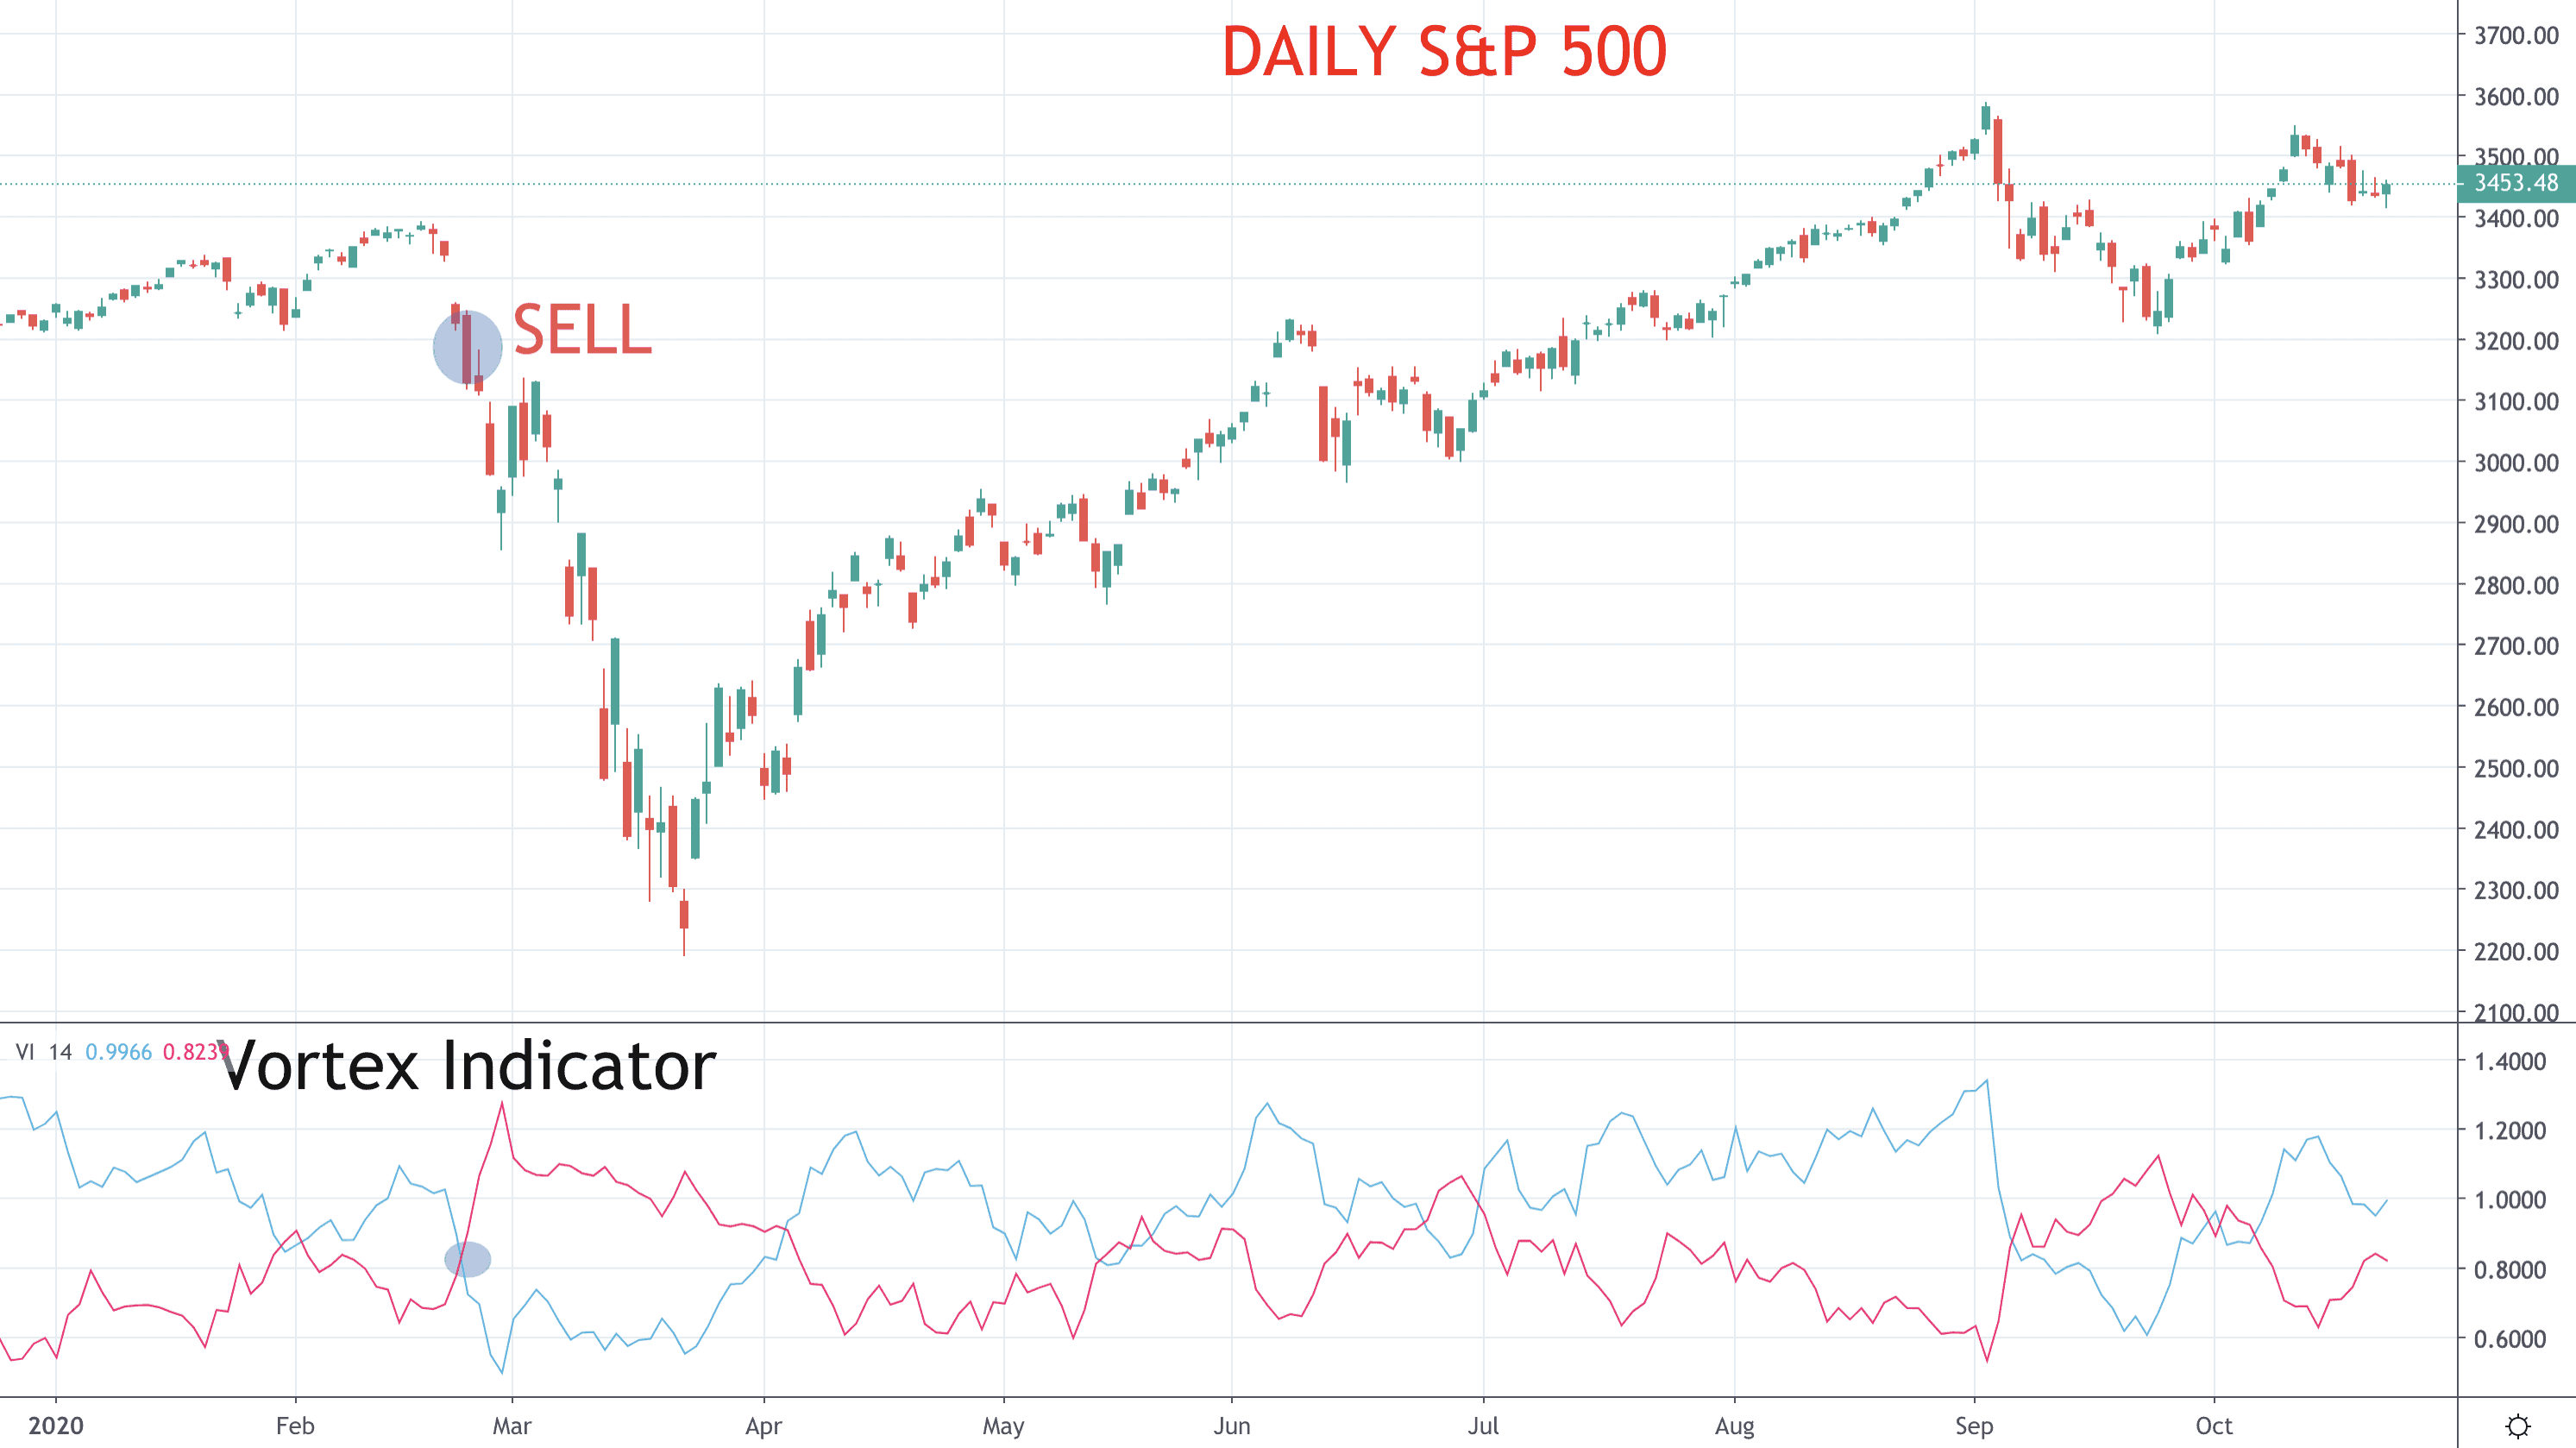
In this first example in the chart below (Figure 2), the Votrex Indicator gave a negative signal with the +VI crossing below the -VI on 25th February 2020. This was a very early signals and presented a great entry price for a shirt at the start of the global spread of thee COVID-19 pandemic. A stop would be placed above the swing high from February and a trailing stop-loss could be used.
Alternatively, an exit could have been signalled by the Votrex Indicator, as we will refer to in Example 2 below.
Figure 2: Daily S&P 500
Buy signals can be equally as profitable, as below.
Example 2: Vortex Indicator Strategy
In this next example, we would use the crossover of the Vortex Indicator as a buy signal in on 6th April 2020. This could have also been used as an exit signal for the short position in Example 1 above. Again, entering a long position here with a stop-loss below the recently set swing low from 1st April would have produced a strong profit. Again, a trailing stop could have been employed, or the Vortex Indicator negative crossover on14th May.
Figure 3: Daily S&P 500
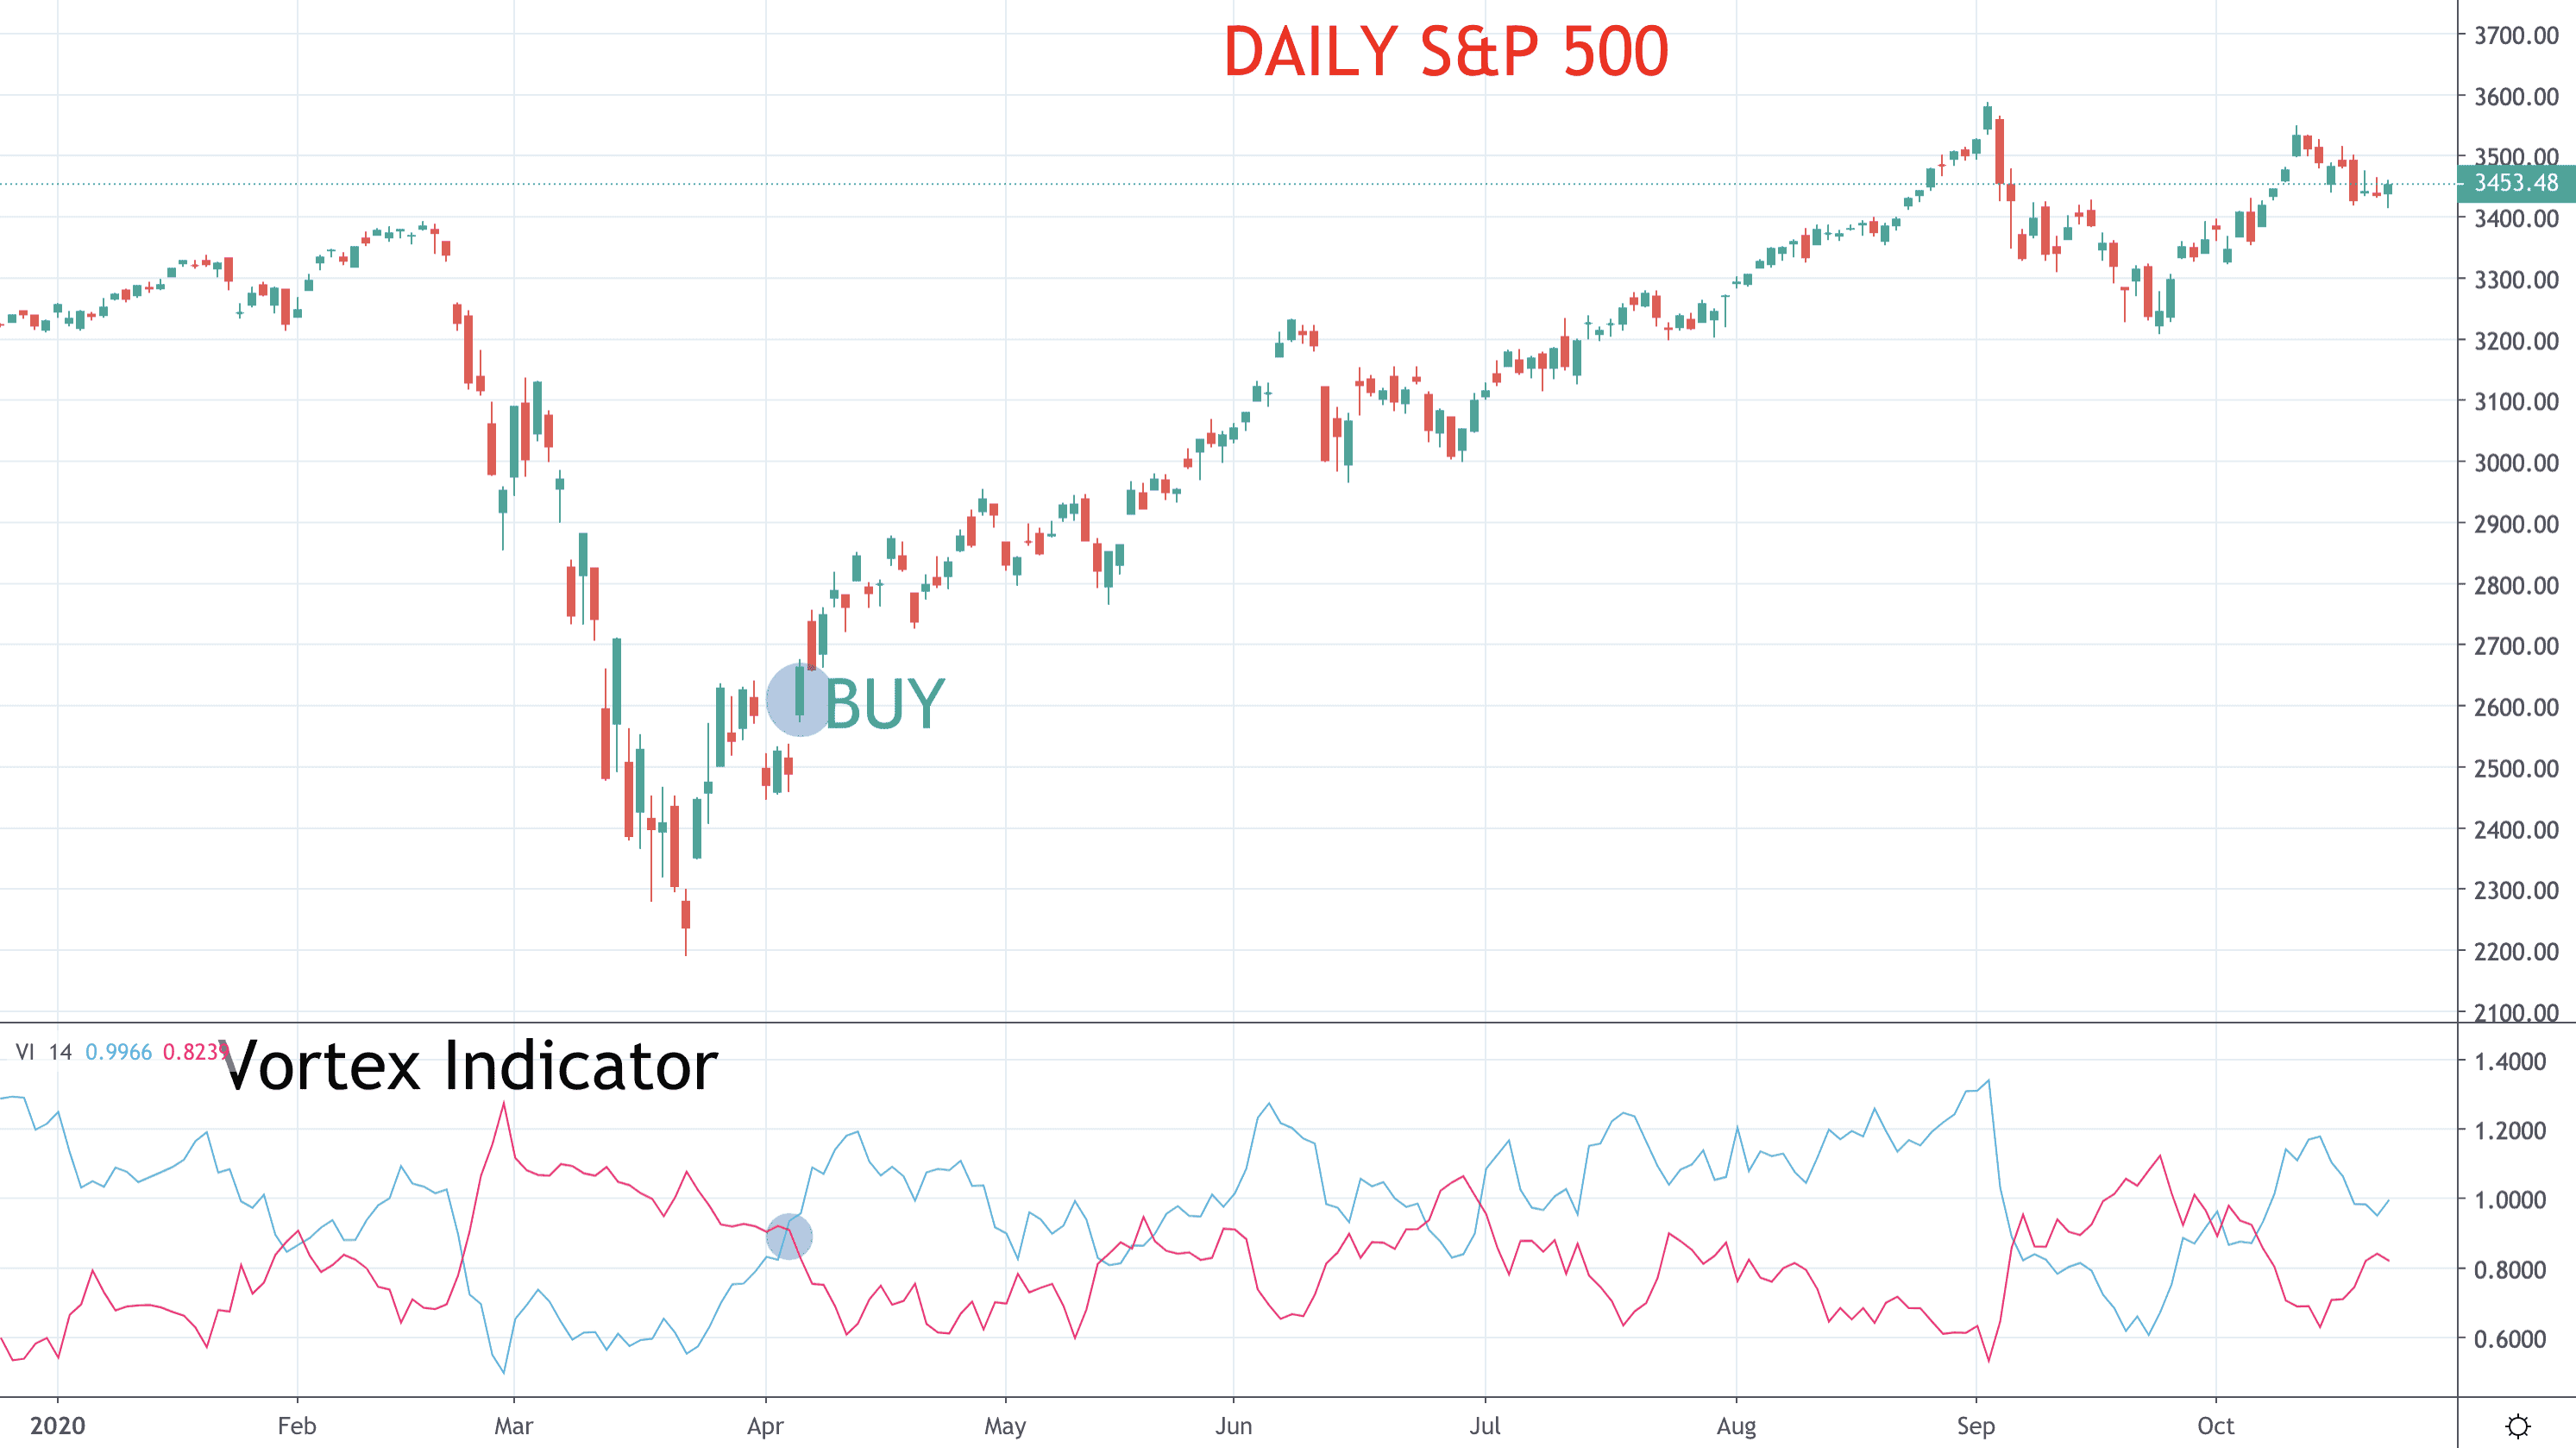
However, as can be seen in May, June and September, sometimes there are less useful signals, and below in Vortex Indicator Strategies section we look at techniques and overlays that can help avoid these less profitable signals.
Vortex Indicator Calculation
There are three steps in the calculation for the Vortex Indicator
- Initially calculate the positive and negative trend movements which are based on the distances between the highs and lows of the past two periods. Positive trend movement is the distance from the current high to the prior low. The further the current period high is from the previous period low, the greater positive “trend movement”. Conversely negative trend movement is calculated as the low now compared to the preceding high, with the wider the distances the more negative the “trend movement”.
- These readings are then calculated over time, usually 14 periods, and then Welles Wilder’s True Range is calculated.
- Then, the aforenoted negative and positive “trend movements” are normalised using the True Range.
To summarise the calculation, the Vortex Indicator rejects positive and negative trend movement adjusted for volatility (defined by the Welles Wilder’s True Range).
Vortex Indicator Strategies
So, the main strategy as we highlight in our examples above is to use crossover signals to enter long and short positions. However, this can lead to unprofitable signals in more sideways markets. There are techniques and overlays that can be employed to try to avoid these unprofitable signals.
- Rather than take the signal on the crossover of the Vortex Indicator positive and negative trend movements, wait for the +VI and -VI to move above/ below a certain level. Maybe above 1.1 for the +VI or below 0.9 for the -VI. This would then filter out some of the more erratic signals before a trend has fully started.
- Use other indicators to qualify and ratify signals from the Vortex Indicator.
- Use primary indicators such as price patterns, trend lines, candlestick patterns etc to confirm signals from the Vortex Indicator
The Bottom Line
- The Vortex Indicator is a trend following indicator developed using the directional movement approach introduced by Welles Wilder.
- Buy and sell signals are easily defined
- Profitability can potentially be improved by overlays.