The Williams Alligator indicator was developed by Bill Williams and tries to identify markets that are starting to trend.
In this guide, we’re going to take a look at:
- What the Williams Alligator Indicator is?
- View some examples trades using the Williams Alligator Indicator
- Look at how the Williams Alligator Indicator is calculated
- Summarise trading approaches using the Williams Alligator Indicator
What is the Williams Alligator Indicator?
The Williams Alligator Indicator is a technical analysis indicator tool that Makes the assumption that markets tend to be in non-trend, sideways range environments for most of the time, but that the profits lie in the occasions when they trend strongly.
The indicator uses three smoothed averages calculated from simple moving averages, with the periods set at the Fibonacci numbers of 5, 8 and 13. These make up the Jaw, Teeth, and Lips of the Alligator, which widen apart and close together as trends and or trading ranges develop.
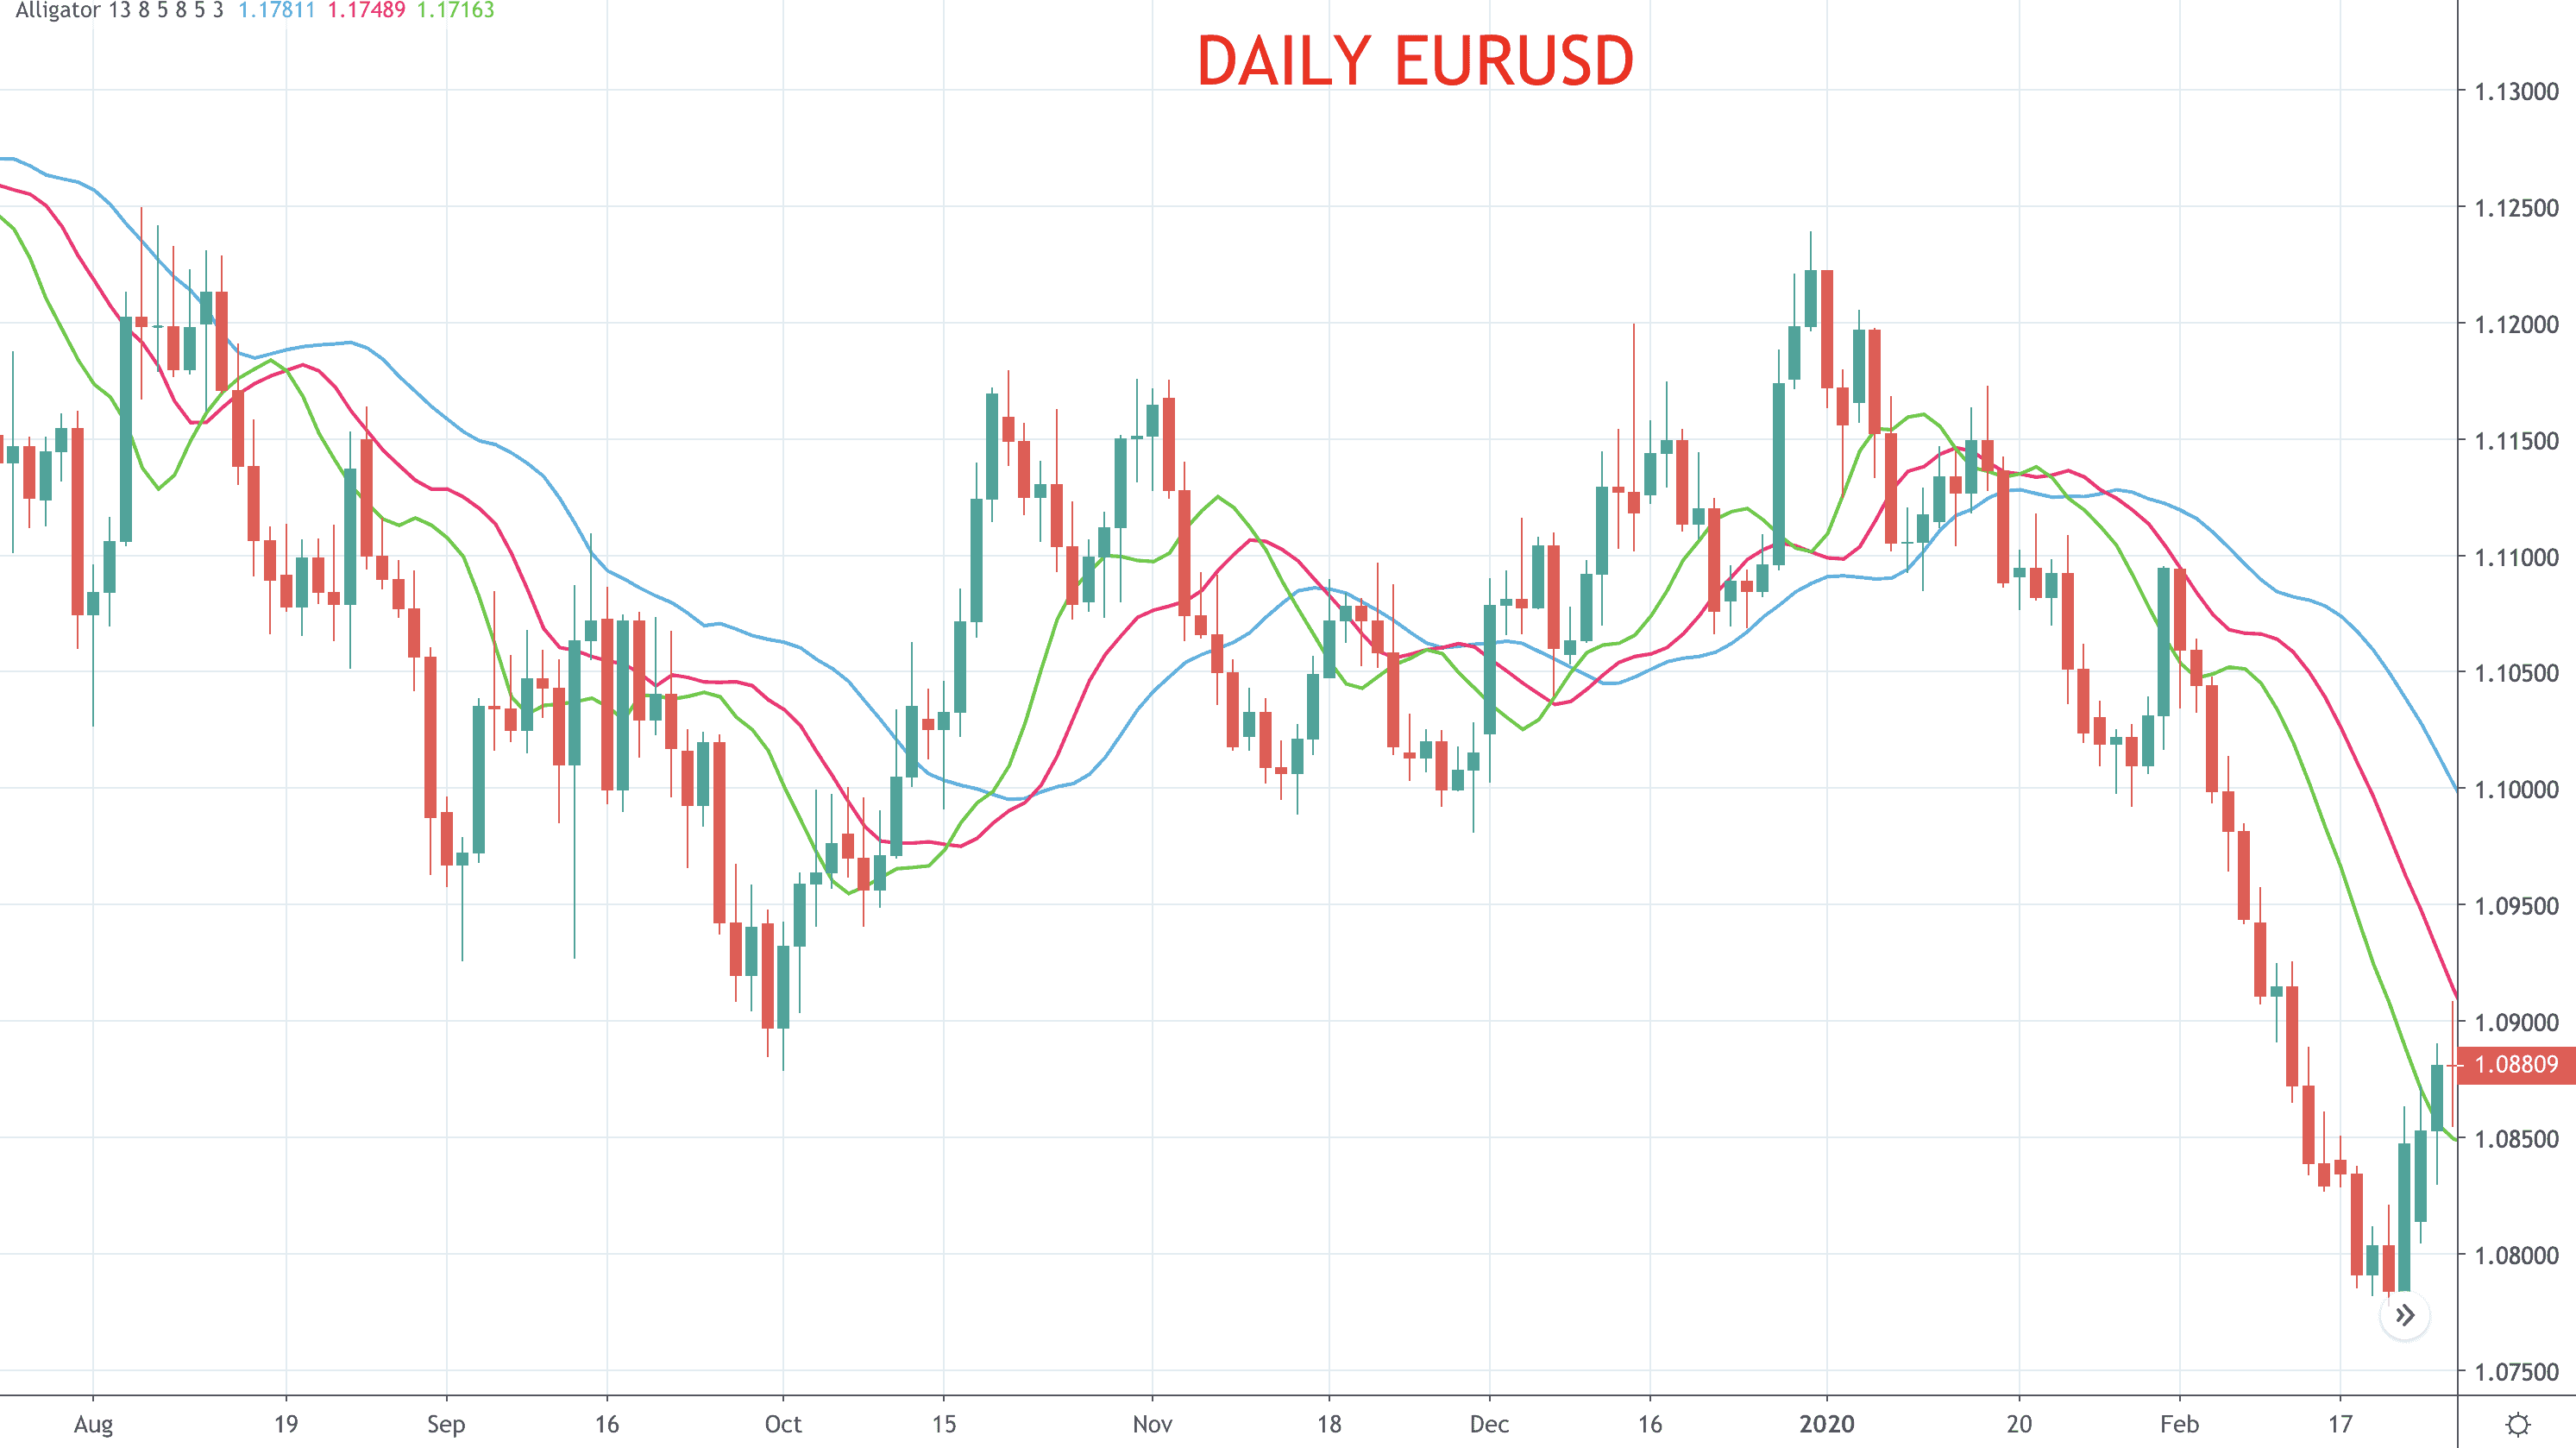
We will look at the detailed calculation of the Williams Alligator Indicator below, but you can see how it looks here in Figure 1. The Jaw is based on the 13-bar smoothed, simple moving average in blue (SSMA), the Teeth in pink on the 8-bar SSMA and the Lips the 5-bar SSMA here in green.
Figure 1: Daily EURUSD
We will look now at how we can profit from the indicator, by looking at Williams Alligator Indicator trading strategies.
Example 1: Williams Alligator Indicator – Trend Emerging Strategy
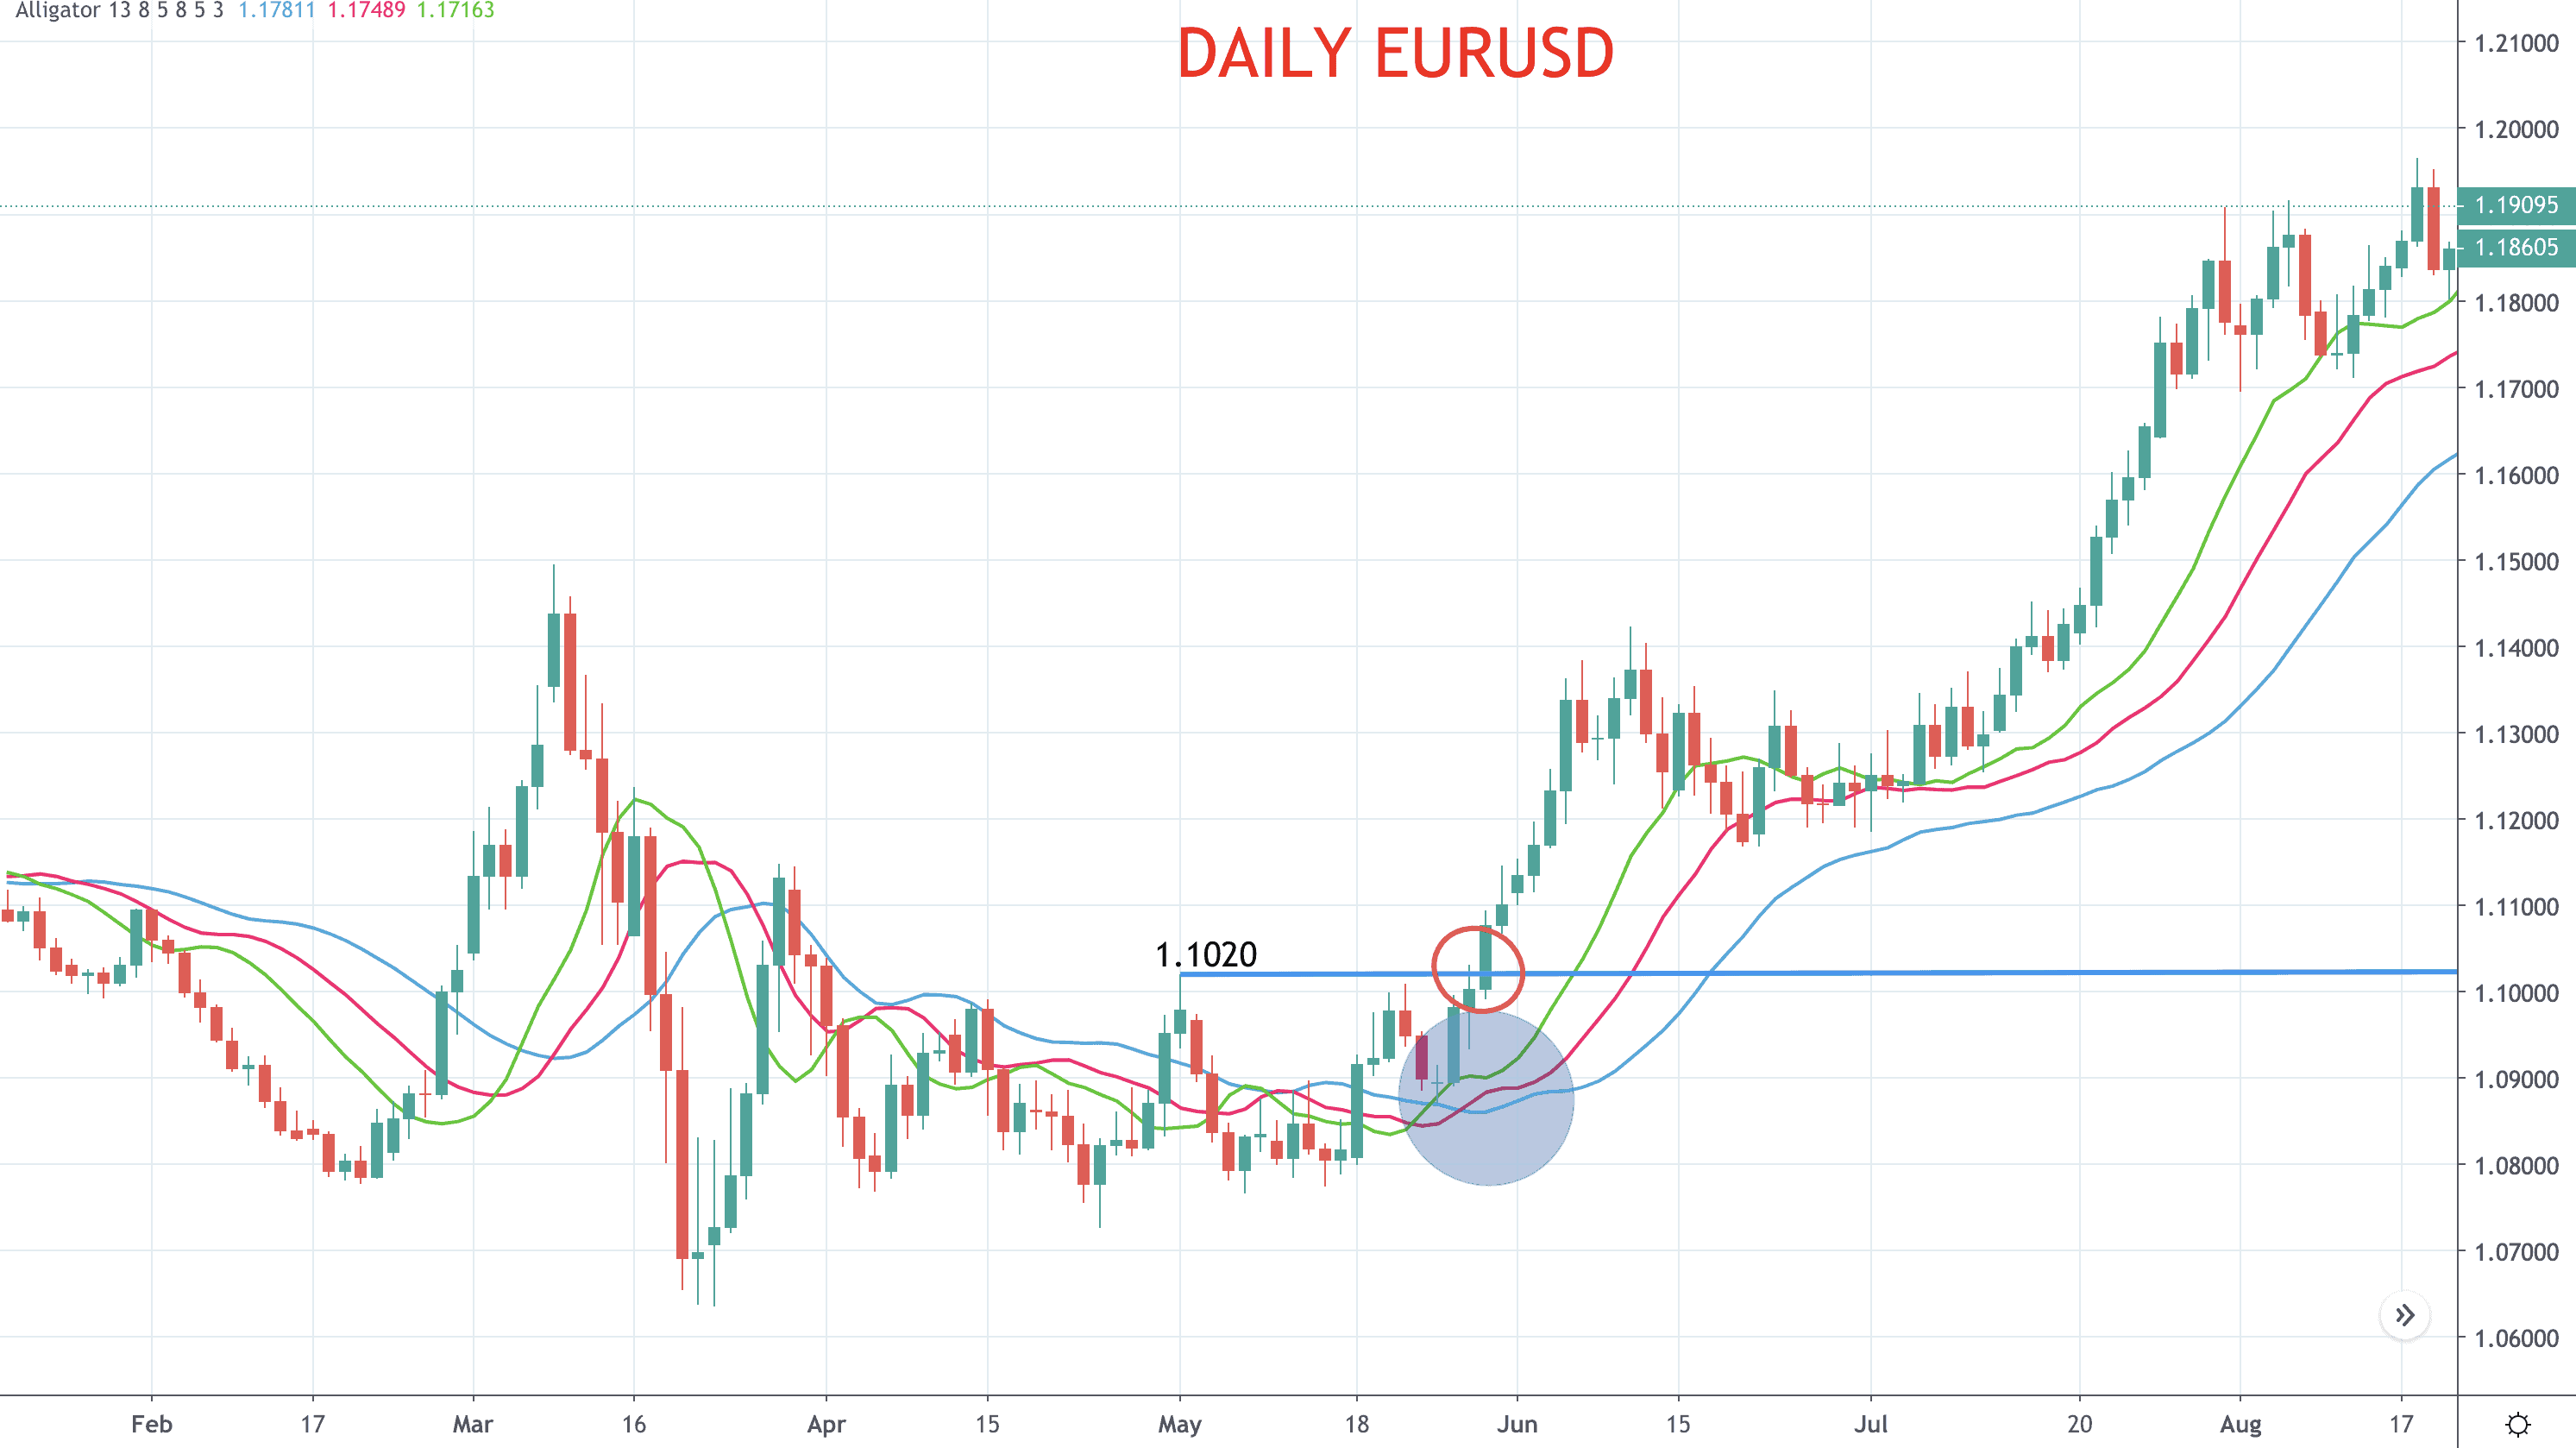
The Williams Alligator Indicator can be used to give buy and sell signals when a trend is about to start. In Figure 2, the daily EURUSD chart, the Williams Alligator is “sleeping” before the blue circle, with the lines tight, in a narrow, horizontal range. Then, once the lines begin to diverge as can be seen within the blue circle, the alligator is said to be “awakening” as a new trend forms. This is reinforced by the Lips line moving above the Teeth and then the Teeth moving above he Jaw line. This has then given us a timing indicator, and we could use a price filter to trigger a buy, long entry position as the market breaks above the 1.1020 swing peak. Then the lines fan out as the Alligator is “feasting”.
Figure 2: Daily EURUSD
Example 2: Williams Alligator Indicator – Correction Strategy
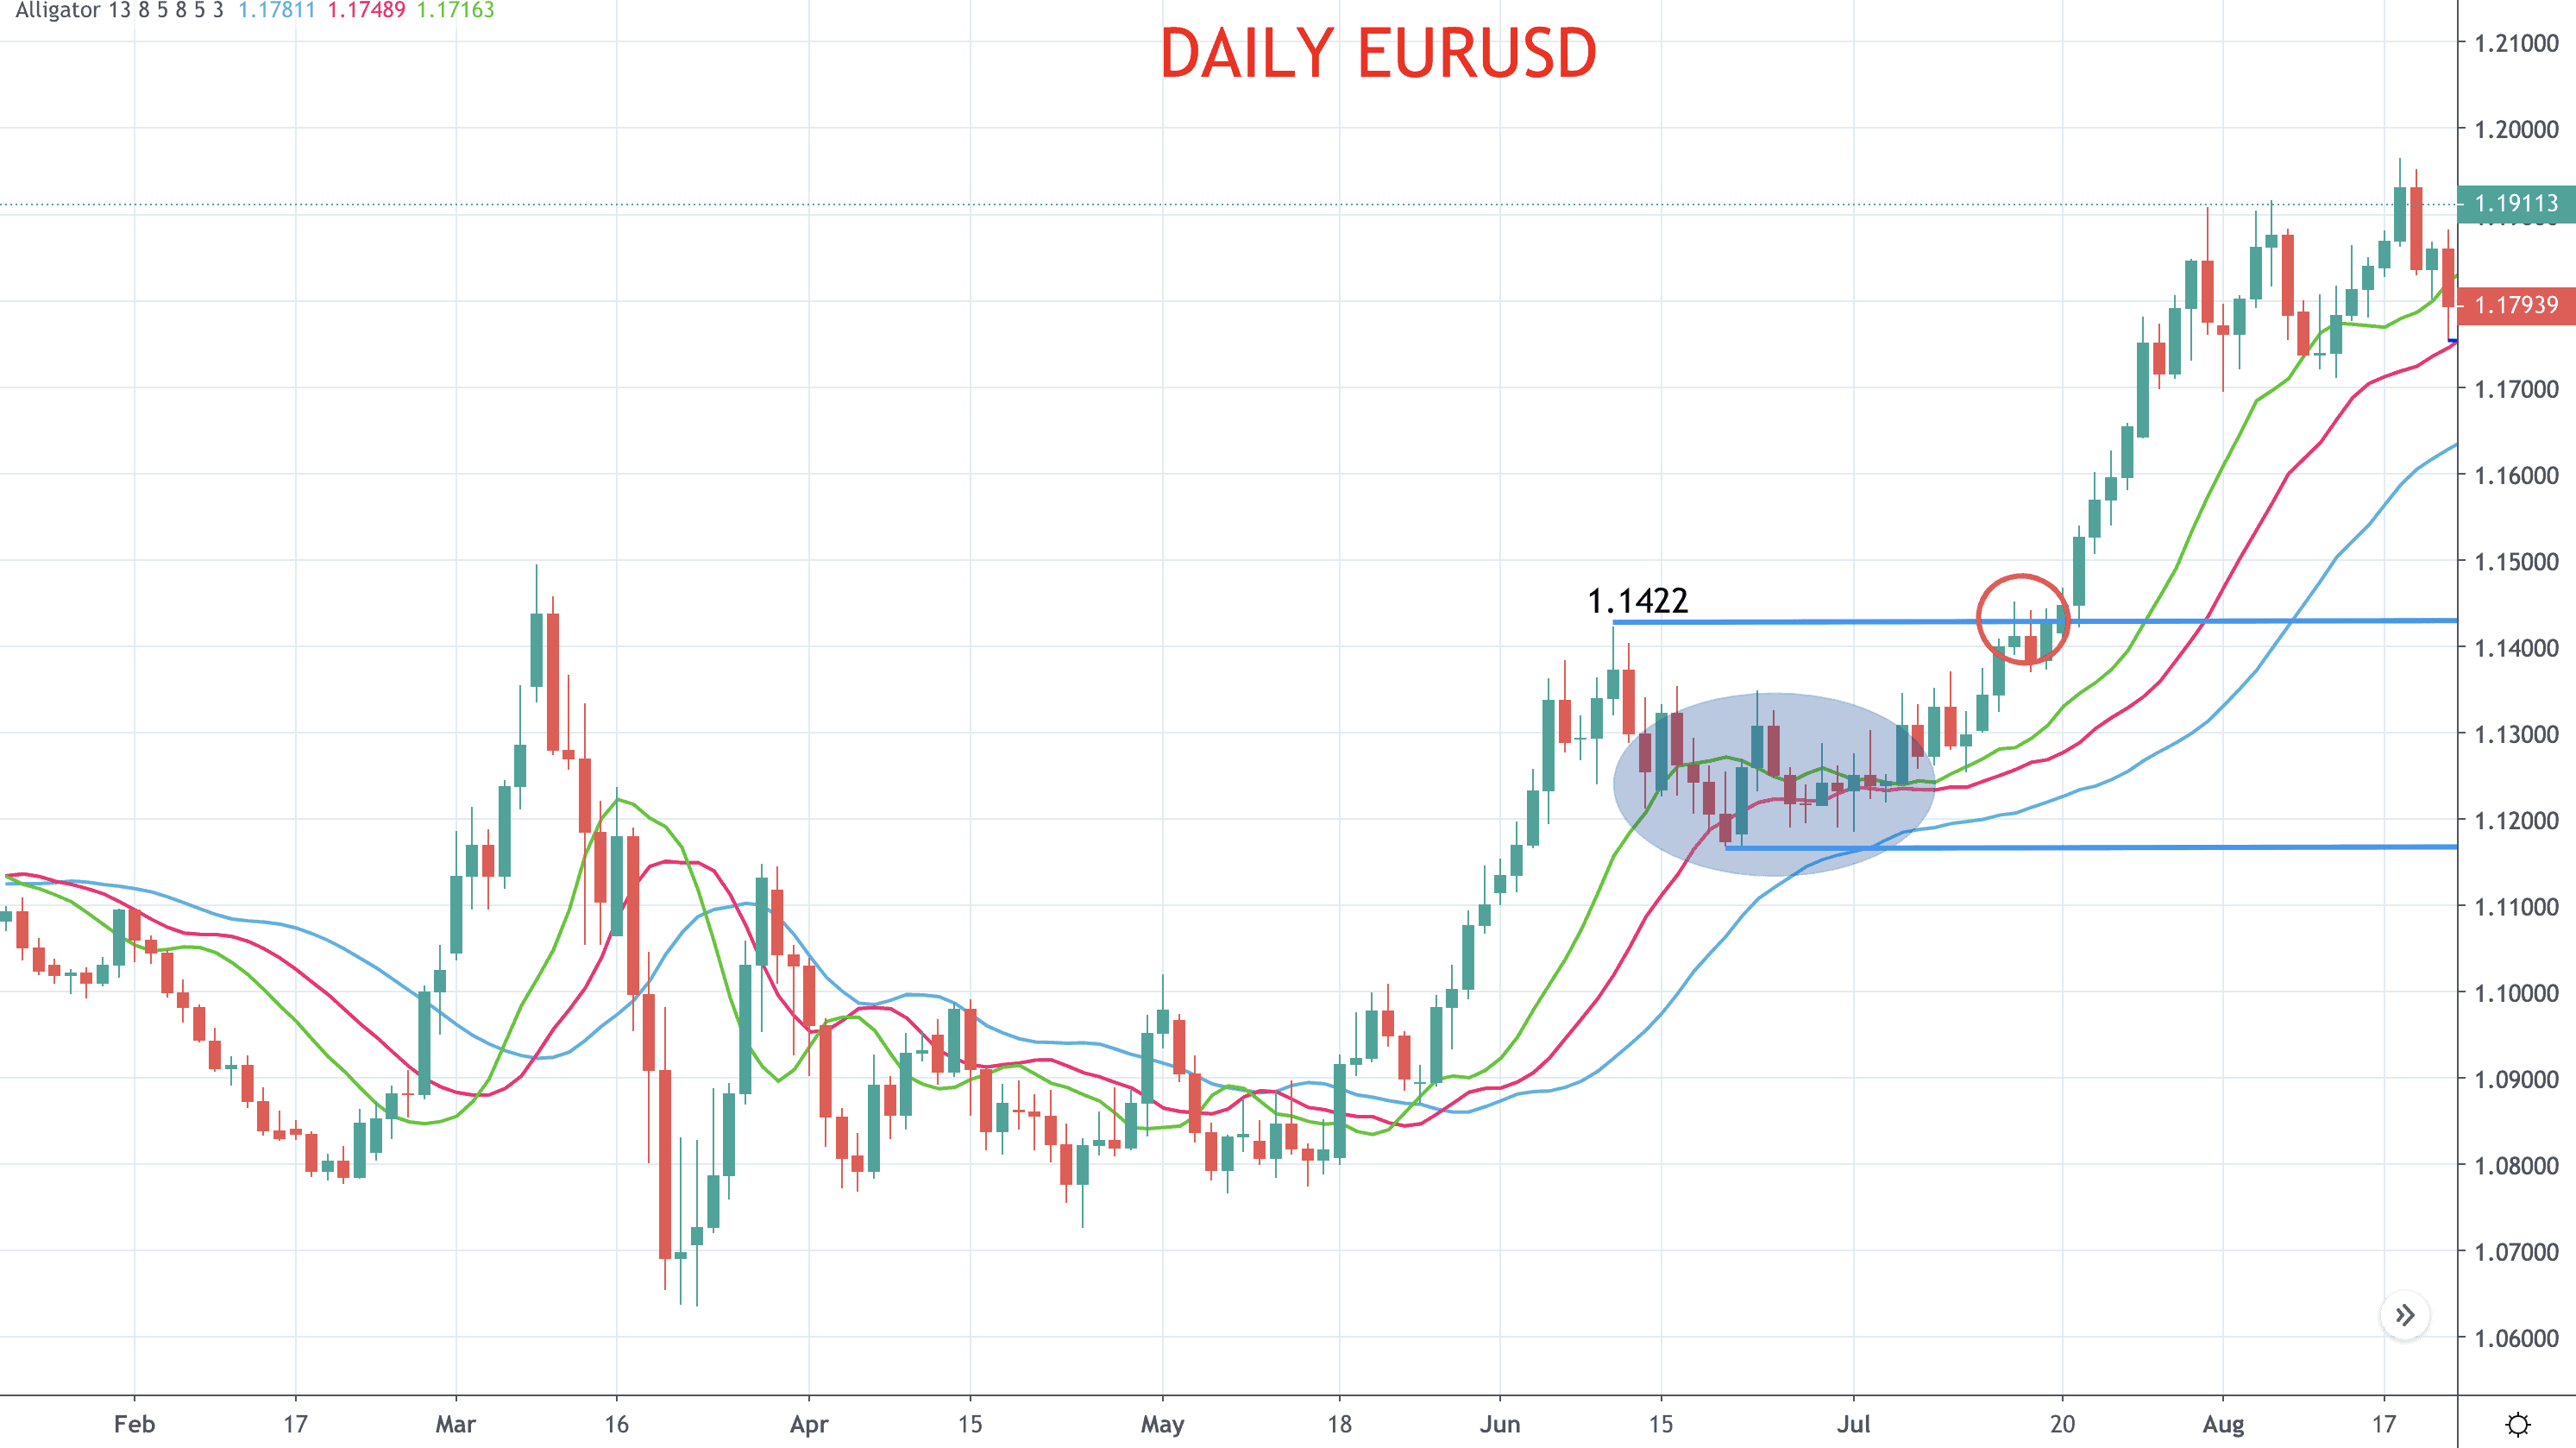
The Williams Alligator Indicator can also be used to give buy and sell signals when a trend correcting. In Figure 3, the same EURUSD daily chart goes into a pullback, corrective consolidation phase after the initial trend as see in Figure 2. During the pullback, you could use the move back down to either the Lips or Teeth line as a buy trigger in the blue circle, with a stop below the blue Jaw line. This would have been a successful long entry trade. Or, you could have seen that the trend was intact, as none of the lines crossed over, and as the market moved back above the 1.1422, then entered long.
Figure 3: Daily EURUSD
Williams Alligator Indicator Calculation
Stand by, because this is quite complex, though you do not have to know the full workings of the calculation.
Simple moving average (SMA):
SUM1 = SUM (CLOSE, N)
SMMA1 = SUM1/N
Subsequent values are:
REVSUM = SMMA(i-1) *N
SMMA(i) = (PREVSUM-SMMA(i-1)+CLOSE(i))/N
Where:
SUM1 – the sum of closing prices for N periods;
PREVSUM – smoothed sum of the previous bar;
SMMA1 – smoothed moving average of the first bar;
SMMA(i) – smoothed moving average of the current bar (except for the first one);
CLOSE(i) – current closing price;
N – the smoothing period.
Due to the intricacy of the calculation, trading software is essential in order to use the indicator.

Williams Alligator Indicator Strategies
These are some differing ways that the Williams Alligator Indicator can be used as a trading strategy.
- The Lips, the faster line, crosses below (or above) the other two lines (Teeth and Jaw) to signal an emerging trend and to give sell (to buy) signals.
- Williams denotes the downward (bearish) cross as the Alligator “sleeping” and the upward (bullish) cross as the Alligator “awakening.”
- The Jaw, Teeth, and Lips of the Alligator moving apart signals a trending phase where short/ long positioning can be maintained. This is seen as the Alligator “eating with mouth wide open”.
- If the Jaw, Teeth, and Lips of the Alligator come together and converge, moving more horizontal, this is a signal of trend ending, indicating profit-taking and position exiting. Williams describes this as the Alligator as “sated”.
The Bottom Line
- The Williams Alligator Indicator is a great tool to signal when a market has truly entered a trending environment.
- There are not any definitive buy or sell signals, however, so other indicators or pattern overlays may be required for triggers and entry/ exit levels.
- During choppy, sideways markets, the Williams Alligator Indicator is far less useful, and can give fake signals and create trading losses. A filter is key.