National Grid shares (LON: NG.) is listed on the London Stock Exchange under the ticker symbol NG. It’s a constituent of the FTSE 100 index, signifying its importance within the leading companies of the UK stock market.
National Grid plc is a British multinational electricity and gas utility business. National Grid, as a company, was founded in 1990 after the privatisation of the electricity industry took place but can trace its roots back as far as 1935.
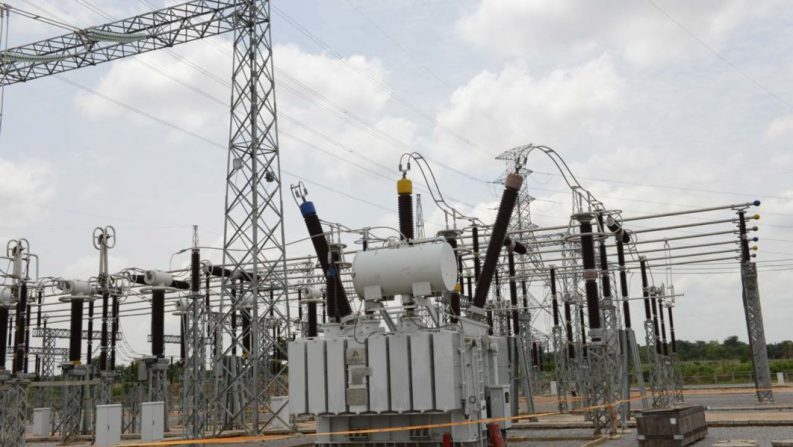
The company plays a vital role in the United Kingdom’s energy infrastructure, operating the high-voltage electricity transmission system in both England and Wales, and the gas transmission system across Great Britain. It also has operations in the US, where its gas and electricity businesses supply energy directly to customers.
National Grid Share Price & Dividends
Recently turning green on the year (July 2024), the National Grid share price has been ranging over the last few months. For the last couple of years, there has been a lack of significant upside or downside momentum. Over the last 12 months, National Grid shares have added a little under 1%.
National Grid does however pay dividends to shareholders. with its current dividend yield at 5.68%.
National Grid Share Price Forecast
Analysts at Exane BNP Paribas are bullish on National Grid shares over the next 12 months. The investment bank recently double-upgraded the stock to Outperform from Underperform with a 1,250p price target. In its March note, the bank said regulated networks remain a way to “sidestep the commodity debate” and still profit from lower multiples after the sector selloff.
National Grid was raised to to Buy from Hold at Jefferies with an increased price target of 1,330p, up from 1,000p also in March. Jefferies analysts said they see the UK’s strategy to overhaul its transmission grid to boost more offshore wind connections as a “game-changer” for National Grid’s growth outlook. In addition, they see the capex outlook in the US gaining momentum and that the next 12-24 months “could dramatically increase visibility on a highly compelling investment case.”
Meanwhile, in January, Deutsche Bank lifted National Grid to Buy from Hold with a 1,150p price target, up from 1,020p per share. The firm cites the company’s strongregulatory asset base growth for the upgrade.
Our View: While National Grid may not be a stock for investors looking for strong growth, those looking to park cash in a dividend name that has stable demand should look further into National Grid shares.
National Grid Stock Suitability
National Grid isn’t a one-size-fits-all investment, and when you factor in your own investing requirements and preferences, it may be a case that the stock may not be right for you. Here’s a breakdown of who might find National Grid shares appealing:
National Grid boasts a history of reliable dividend payouts, with a current yield above the market average. This makes it attractive for investors seeking regular income streams from their portfolios.
National Grid operates in a critical infrastructure sector with stable demand for its services. Investors with a long-term outlook can benefit from potential share price appreciation alongside consistent dividends.
National Grid’s business is relatively insulated from economic downturns because electricity and gas are essential utilities. Investors looking for stability during market fluctuations might find National Grid shares a valuable addition to their portfolios.
National Grid provides essential utilities like electricity and gas. Demand for these services remains relatively stable even during economic downturns, making the stock suitable for investors with low risk tolerance.
On the other hand, National Grid’s mature core business might limit significant growth. Investors seeking high-growth opportunities might find better options elsewhere.