THG (The Hut Group) is a British e-commerce group and brand owner. It has a portfolio of digital beauty, health, wellness, and sports nutrition brands and operates under three core units: THG Beauty, THG Nutrition, and THG Ingenuity.
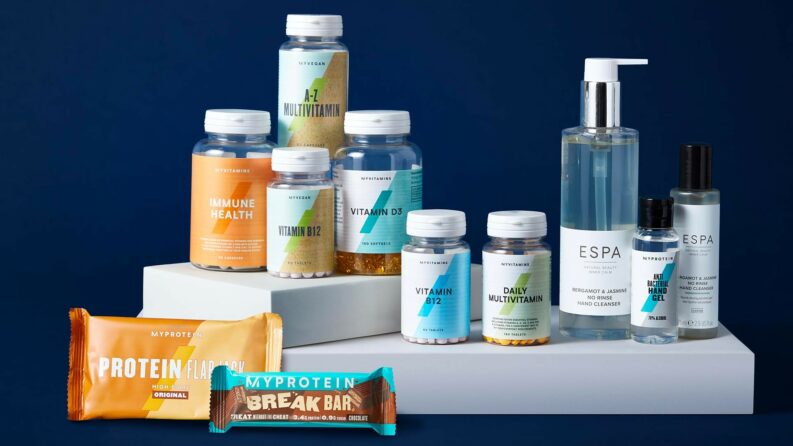
Under its Nutrition division, the company has brands such as Myprotein and its family brands such as MyPro and MyVitamins. In its Beauty division, there are brands, including LOOKFANTASTIC, Cult Beauty, and Dermstore.
Meanwhile, its Ingenuity division is an e-commerce platform that “powers digital experience and retail for FMCG, beauty and retail brands globally.”
The company was founded in 2004 by current Chief Executive Officer Matthew Moulding. The company is listed on the London Stock Exchange under the ticker “THG.”
THG Share Price & P/S Ratio
The THG share price has had an extremely tough time since its IPO in September 2020. After climbing to over 800p per share, the stock began to decline in 2021 and has struggled for any real upside momentum since. Before its IPO, it was one of the most valuable private companies in the UK.
THG’s current price-to-sales ratio trailing twelve months (TTM): 0.383226 (Source: CompaniesMarketCap)
THG Share Price Forecast
Overall, analysts are mostly bullish on THG shares despite the stock’s downturn in recent years, suggesting they see the low share price as providing an attractive entry point. Five currently have a Buy rating on THG shares, with three assigning the stock a Hold rating and one assigning a Sell rating.
In October 2023, HSBC raised its rating for THG to Buy from Hold, lowering the price target to 100p from 105p per share. Analysts at the bank noted (at the time) that the company reported an inflection point in its third-quarter sales momentum, as well as a positive exit run rate and lower input costs, de-risking its short-term earnings outlook.
Meanwhile, in June 2023, Barclays reinstated THG with an Equal Weight rating and 87p price target following what it described as the company’s “encouraging” trading statement. The bank noted that THG’s operational momentum is improving, and it has made further steps towards cleaner governance. In its note, Barclays said it sees “a potentially attractive upside case if better delivery on forecasts continues.”
Our View: The THG share price chart doesn’t look pretty, and the company’s CEO has slammed the London Stock Exchange on several occasions. Given the company is not yet profitable, there are, of course, risks that need to be carefully assessed first. However, for investors looking for companies with growth potential, it may be one to consider.
Who Should Buy THG Shares
THG is a well-known London-listed company. As such, it presents provides enticing opportunity for investors seeking exposure to the rapidly evolving digital retail landscape. However, there are also more personal factors to consider before deciding whether THG is a good fit for your portfolio:
Investing in THG requires a careful assessment of risk tolerance. As mentioned earlier, the THG share price had fallen considerably between 2021 and 2022. THG operates in a competitive environment with fast-paced innovation, which may appeal to investors comfortable with a moderate to high risk tolerance.
While THG has not historically paid dividends, its growth-oriented strategy may appeal to investors prioritising capital appreciation over regular income streams.
THG’s innovative business model and global presence may make it an attractive option for investors looking for long-term growth potential. Its diverse brand portfolio and technological capabilities provide a strong foundation for capturing opportunities in the digital marketplace.
Considering THG’s recent stock price performance, some investors may perceive its current valuation as attractive, offering the potential as a growth stock. However, potential investors should also note that THG is not yet profitable.