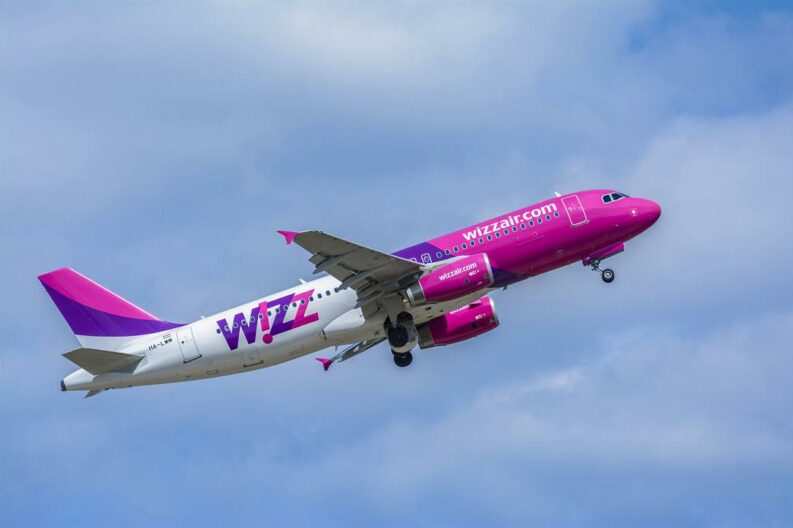
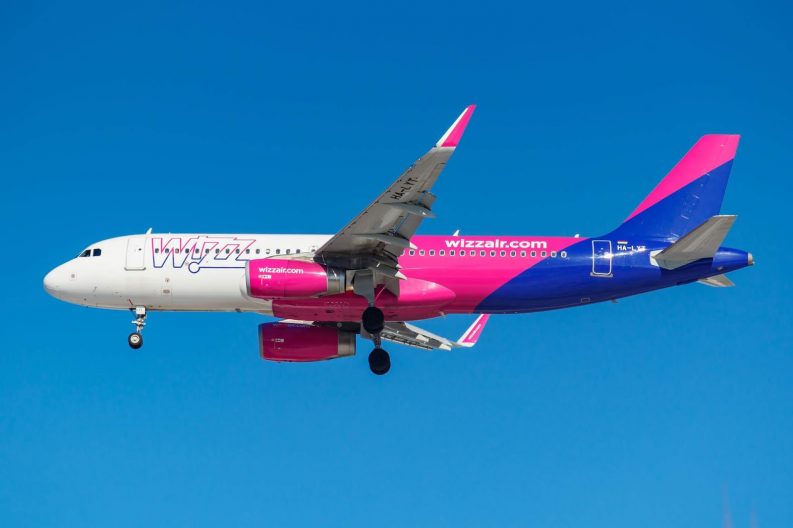
Wizz Air Holdings, a Hungarian low-cost carrier airline group headquartered in Budapest, was founded in 2003. The airline has grown rapidly to become a major player in the European and Central Asian aviation markets.
The company has over 950 routes, flying to destinations across Europe, Asia Pacific, the Middle East and Africa. The current Wizz Air CEO is József Váradi, who was one of the founders of Wizz Air in 2003.
For investors, Wizz Air Holdings is listed on the London Stock Exchange (LSE) under the ticker symbol WIZZ. The company is also a constituent of the FTSE 250 Index, indicating its position as a mid-sized but impactful company on the LSE.
Wizz Air Share Price & Dividend Yield
When Wizz Air IPO’d in 2015, its stock was priced at 1,150p per share. It rallied soon after, and by March 2021, Wizz Air shares hit a high of over 5,400p. Since then, the stock has fallen significantly, currently trading below the 2000p mark.
P/E Ratio Average Over the Last Five Years: 13.28
Wizz Air Share Price Forecast
Overall, according to data compiled by TradingView, out of 20 analysts covering the stock, nine currently have a Buy rating on Wizz Air shares. Nine have given the stock a Hold rating, and two analysts has assigned the airline a Sell rating.
A View From The Bulls: FollowingWizz Air’s May earnings release, analysts at RBC Capital maintained the company’s rating at Outperform, with their new price target of 3,300p predicting significant potential upside in the stock. The bank said in its reaction note that they think Wizz Air has “strong medium-term growth credentials.”
A View From The Bears: In a January note, analysts at Liberum downgraded Wizz Air to Sell from Hold with a 1,700p price target, while in February, Wizz Air was downgraded to Neutral from Buy at Redburn Atlantic with a 2,400p price target.
Redburn analysts downgraded various network airlines to Neutral based on its view of declining earnings in 2024. The investment firm felt that demand for air travel showed little sign of slowing. They noted that following very robust pricing last summer, maintaining pricing growth through this year will become a challenge.
Average Analyst Consensus 12-Month Price Target: 2,706p
Our View: Wizz Air shares certainly offer an attractive proposition, especially given the fact that the company returned to profit in FY24. However, there are still headwinds, including geopolitical instability and supply chain disruptions due to GTF engine inspection, which potential investors should first thoroughly consider.
Who Should Buy Wizz Air Shares
Wizz Air offers an attractive opportunity for certain investors, but it’s not a stock for all investor types. Here’s who might find Wizz Air shares appealing:
The airline industry can be cyclical and vulnerable to external factors like fuel prices and economic fluctuations. Investors who can stomach potential short-term volatility and are comfortable with a long-term investment horizon may find Wizz Air a good fit.
Wizz Air’s success hinges on its efficient, low-cost operations. Investors confident in the continued viability and growth of the budget airline model may find Wizz Air an attractive play.
If Wizz Air’s share price is deemed undervalued compared to its future prospects, some investors may view this as a buying opportunity. This hinges on their belief that the company can overcome current challenges.
Unlike some established airlines, Wizz Air does not currently pay dividends. Investors seeking regular income from their investments may want to consider alternative options.
Investors looking for airlines with a strong presence in the Central and Eastern European markets will definitely want to assess Wizz Air further.