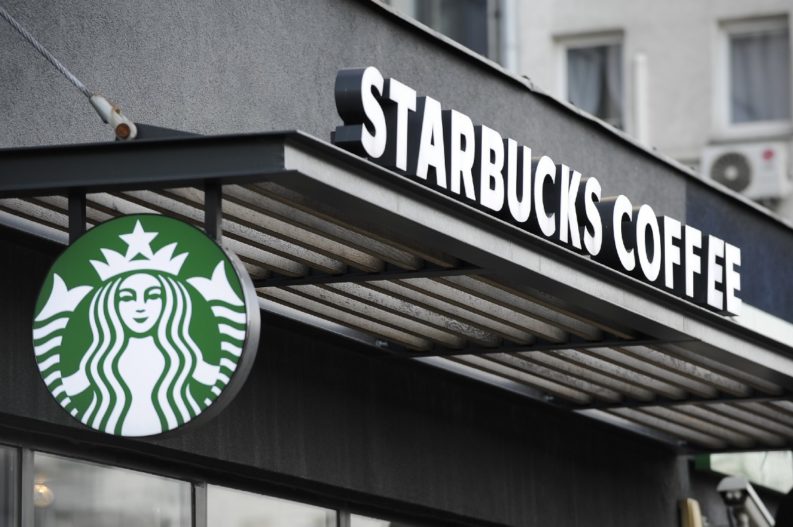
Starbucks stock (NASDAQ:SBUX) has been rallying since the start of 2026, up 13.99% YTD. The bulls are taking a breather ahead of this morning’s earnings call, with the stock 0.8% in the pre-market leading in at $94.95.
One of the key points to watch will be whether the company’s operational reset under CEO Brian Niccol is translating into sustainable traffic recovery after six consecutive quarters of negative comparable sales.
Expectations on the quarter are for $0.58 EPS on $9.65B revenue, representing a 15.9% decline in earnings versus the prior-year quarter despite modest topline growth.
 WELCOME BONUS - Free Share Bundle When You Invest £50!
Get up to £500 cashback for investing with IG.
WELCOME BONUS - Free Share Bundle When You Invest £50!
Get up to £500 cashback for investing with IG.
Management signaled that U.S. company-operated comparable sales turned positive in September and remained positive through October, creating expectations for continued momentum. The company’s inaugural investor day follows immediately on January 29, amplifying the importance of this print.
A result that merely meets consensus while failing to demonstrate margin stabilization would likely re-open questions about whether the turnaround is becoming structurally more expensive.
$109.5B
59.1
$0.58
$9.65B
Starbucks reports fiscal Q1 2026 results Wednesday morning, with U.S. traffic trends and margin trajectory under scrutiny.
The quarter will determine whether Starbucks can clear the dual hurdle of traffic improvement and profitability normalization.
The company’s track record shows three misses in the trailing four quarters, with an average shortfall of 10.1%, while post-earnings price reactions have been driven more by forward guidance and traffic trajectory than by quarterly EPS precision.
Here’s a closer look at the details broken down.
Consensus Estimates
| Metric | Consensus Est. | Range | YoY Change |
|---|---|---|---|
| EPS (Adjusted) | $0.58 | $0.50 – $0.67 | -15.9% |
| Revenue | $9.65B | $9.49B – $9.79B | +2.7% |
| North America Revenue | $7.12B | N/A | +0.7% |
| International Revenue | $1.53B | N/A | +8.2% |
Analysts Covering: 29 (EPS) / 24 (Revenue)
Estimate Revisions (30d): 1 up / multiple down (-3.6%)
The consensus EPS of $0.58 reflects a 15.9% decline from the prior-year quarter’s $0.69, despite revenue expectations calling for 2.7% growth. This divergence captures the core tension in the quarter: topline stabilization is occurring, but margin compression from labor investment, commodity inflation, and restructuring is overwhelming the revenue improvement.
Management Guidance & Commentary
“U.S. company-operated comparable sales turned positive in September and stayed positive into October, signaling momentum entering the fiscal first quarter.”
Management’s commentary from the prior quarter established that U.S. comps inflected positive in September for the first time in two years and sustained that trajectory through October. This statement set the bar for Q1: the market expects not just positive comps, but evidence that the improvement is durable and driven by transactions rather than price.
The upcoming investor day on January 29 adds a layer of complexity. Management is expected to outline a multi-year strategic roadmap, including details on general and administrative expense efficiencies and productivity gains. This timing suggests the company intends to use Q1 results as a foundation for longer-term guidance.
Analyst Price Targets & Ratings
Wall Street sentiment remains cautious, with 45% of analysts rating shares a Hold and only 45% maintaining Buy or Strong Buy ratings. The consensus target of $96.42 implies minimal upside from current levels, reflecting uncertainty about the turnaround timeline and margin recovery prospects.
Sector & Peer Comparison
| Company | Ticker | Market Cap | P/E | Fwd P/E | Profit Margin |
|---|---|---|---|---|---|
|
Starbucks Corporation
⭐ Focus |
SBUX | $109.5B | 59.1 | 37.9 | 5.0% |
|
McDonald’s Corporation
|
MCD | $214.3B | 25.8 | 23.1 | 32.1% |
|
Chipotle Mexican Grill
|
CMG | $84.2B | 52.3 | 44.2 | 16.9% |
|
Yum! Brands
|
YUM | $38.1B | 27.4 | 22.8 | 24.3% |
|
Restaurant Brands Intl
|
QSR | $33.2B | 22.6 | 19.4 | 28.7% |
|
Domino’s Pizza
|
DPZ | $16.8B | 28.1 | 25.3 | 13.2% |
Starbucks trades at a 37.9x forward P/E, a 53% premium to the restaurant industry average of 24.8x and well above most direct peers. McDonald’s, with a significantly higher profit margin of 32.1%, trades at only 23.1x forward earnings. The profit margin gap is the critical issue—Starbucks’ 5.0% profit margin ranks at the bottom of the peer group.
Earnings Track Record
| Quarter | EPS Actual | EPS Est. | Result | Surprise % |
|---|---|---|---|---|
| Q4 FY25 (Sep 2025) | $0.52 | $0.58 | Miss | -10.3% |
| Q3 FY25 (Jun 2025) | $0.50 | $0.65 | Miss | -23.1% |
| Q2 FY25 (Mar 2025) | $0.41 | $0.48 | Miss | -14.6% |
| Q1 FY25 (Dec 2024) | $0.69 | $0.67 | Beat | +3.0% |
| Q4 FY24 (Sep 2024) | $0.80 | $0.89 | Miss | -10.1% |
Starbucks has missed consensus estimates in three of the trailing four quarters, with an average shortfall of 10.1%. The Q3 FY25 miss of 23.1% was the largest in recent history, driven by margin compression from labor investment and one-time costs. The company’s 45.0% beat rate over the trailing 20 quarters reflects a persistent pattern of overestimating near-term profitability.

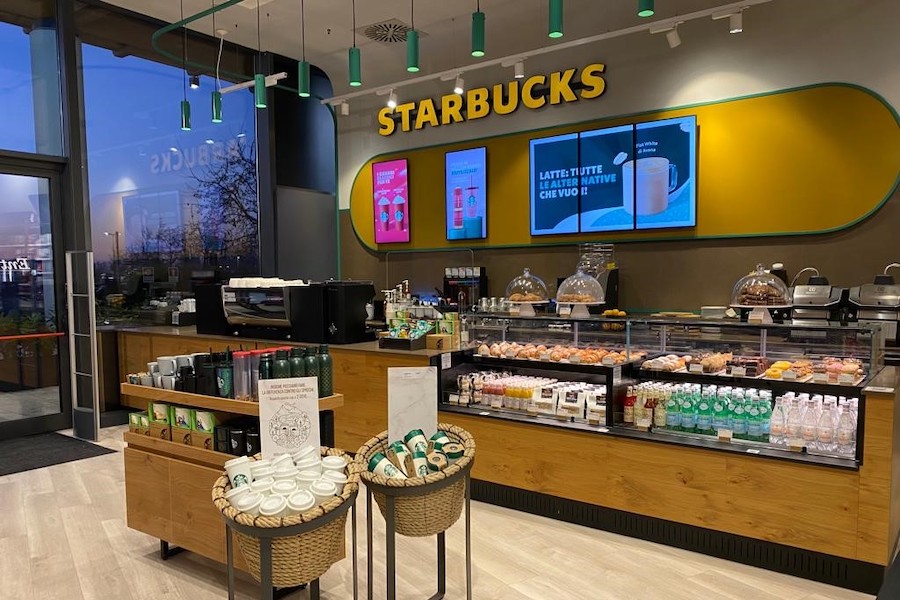
Mobile ordering and menu innovation have supported revenue, but profitability remains under pressure from elevated costs.
Post-Earnings Price Movement History
| Date | Surprise | EPS vs Est. | Next Day Move | Price Change |
|---|---|---|---|---|
| Q4 FY25 (Sep 2025) | -10.3% | $0.52 vs $0.58 | -1.4% | $85.64 to $84.40 |
| Q3 FY25 (Jun 2025) | -23.1% | $0.50 vs $0.65 | +3.1% | $92.11 to $94.92 |
| Q2 FY25 (Mar 2025) | -14.6% | $0.41 vs $0.48 | +0.5% | $97.73 to $98.23 |
| Q1 FY25 (Dec 2024) | +3.0% | $0.69 vs $0.67 | +1.8% | $90.58 to $92.17 |
The Q3 FY25 reaction is instructive. Despite a 23.1% EPS miss, the stock rallied 3.1% the next day as management highlighted revenue beat, international momentum, and operational progress. The market chose to trade the narrative of turnaround traction rather than the quarterly profitability shortfall.
Expected Move & Implied Volatility
Elevated
3.81%
+112% premium
Options traders are pricing an 8.08% move in either direction, implying a range of $88.55 to $104.11. This expected move is 112% above the stock’s average historical post-earnings move of 3.81%, indicating elevated uncertainty around this specific earnings event.
Expert Predictions & What to Watch
Key Outlook: Guidance Will Drive the Trade
Key Metrics to Watch
The company’s premium positioning and store experience investments are central to the turnaround strategy but require sustained traffic growth to justify costs.
U.S. comparable sales growth is the single most important metric. Management’s commentary that comps turned positive in September and remained positive through October set the bar for this quarter. A positive result validates the operational reset, while flat or negative comps would force the market to question whether the momentum was sustainable.
Operating margin trajectory will determine whether the stock can sustain its valuation premium. The company’s 11.0% operating margin is well below the mid-to-high-teens target range that management has previously discussed. Further compression would signal that labor investment and commodity inflation are overwhelming revenue gains.
Searching for the Perfect Broker?
Supplement your charting with a free trading platform that rivals the best out there – multiple charts on one screen for easy monitoring, ProRealTime provides the perfect support for your investing or trading journey.
Discover our top-recommended brokers for trading stocks, forex, cryptos, and beyond. Dive in and test their capabilities with complimentary demo accounts today!
- IG Top-tier regulation – Read our Review
- eToro Wide range of instruments available to trade – Read our Review
YOUR CAPITAL IS AT RISK. 76% OF RETAIL CFD ACCOUNTS LOSE MONEY

