Volume Weighted Average Price, or “VWAP” trading strategies, helps active traders identify trade entry and exit points by using data relating to the amount of an asset traded, not just the prices recorded. It combines price and volume data to paint a dynamic picture of market sentiment, revealing valuable insights for savvy traders.
YOUR CAPITAL IS AT RISK
VWAP trading strategies are intra-day strategies that are very popular with day traders. Most of the VWAP-style activity occurs at institutional investment houses such as hedge funds and investment banks.
So not only does understanding VWAP offer the opportunity to spot trading signals and make a profit over a short time frame, but it also sheds light on where the big money is heading. Here’s how to implement it.
Table of contents
What is VWAP & How is it Calculated?
What is it? VWAP is ultimately calculated using a mathematical formula. The highest-level summary description describes VWAP as the ratio of an asset’s average price compared to the volume of trades in that asset over a particular time frame. Breaking out the formula used to calculate VWAP using numbers can help explain the mechanics of the process.
Calculation: The calculation starts by taking the price of an asset at the opening of the trading session. If using five-minute candles, the high and low price of that five minutes of trading is used in conjunction with the closing price. If the exchange opens at 8.00, then VWAP uses the highest and lowest prices printed between 8.00–8.05 and the closing price at 8.05 and calculates the average Typical Price (TP) by dividing the total of those by three.
- High + Low+ Close /3
The below chart shows the price action of BARC shares traded on the LSE where 183.82 + 182.96 + 182.96 / 3 = 183.2467 = TP
Barclays – Calculating VWAP
Source: IG
The volume of shares traded in that time interval was 28,000, and this is multiplied by the Typical Price to give the Total Price Volume (TPV). So:
- 82 + 182.96 + 182.96 / 3 = 183.2467
- 2467 x 28,000 = 5,130,907
- TPV = 5,130,907
The next five-minute candle for the period 8.05–8.10 incorporates the TPV for both periods. This is expressed as:
[TPV Candle 1 + TPV Candle 2] / [Volume Candle 1 = Volume Candle 2]
Where Candle 1: 8.00–8.05 and Candle 2: 8.05–8.10
- 5,130,907 + [(183.16 + 182.84 + 182.88 / 3) x 42,500] / [28,000 + 42,500]
- 5,130,907 + 7,775,800 / 70,500 = 183.0739
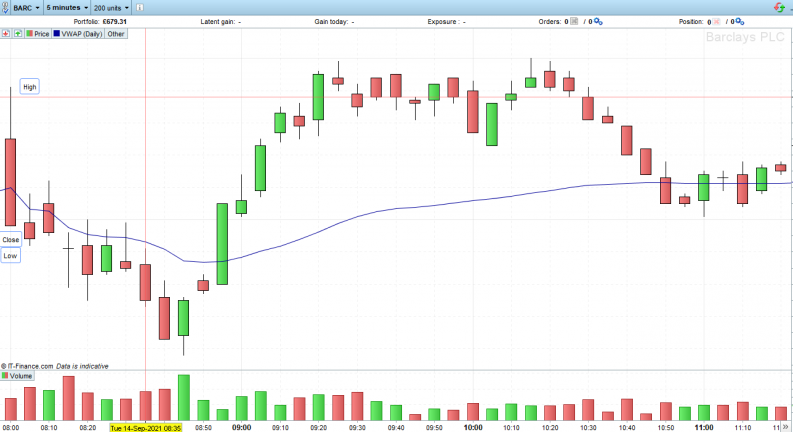
The formula breakdown highlights why some analysts perceive VWAP as a better gauge of ‘real’ price than a simple mean average of high, low and closing prices. A lot of buying and selling activity at a particular level is reflected in the VWAP but not a simple mean average formula.
Barclays – Calculating VWAP
Source: IG
Fortunately, analysts and traders can set up accounts with brokers that have charting packages allowing VWAP to be calculated and overlayed onto any price chart. The blue line on the above price chart for Barclays’ stock shows the VWAP, and the red cross marks the number at 8.10.
Note: Time intervals are set at traders’ discretion and can include periods other than five minutes, but VWAP only uses intraday data, so it can only be used for intraday trading strategies.
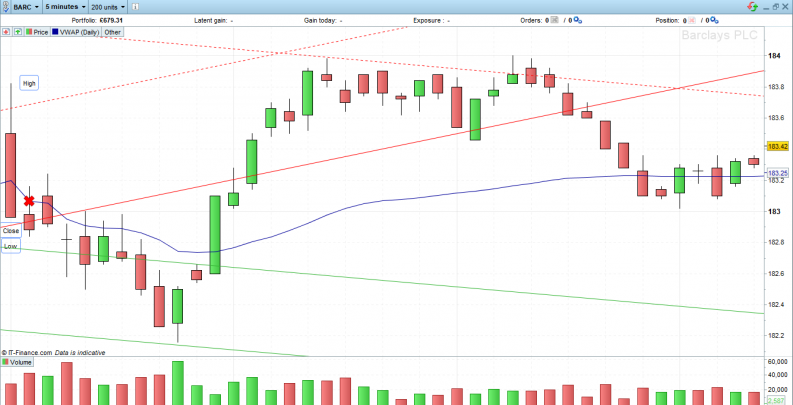
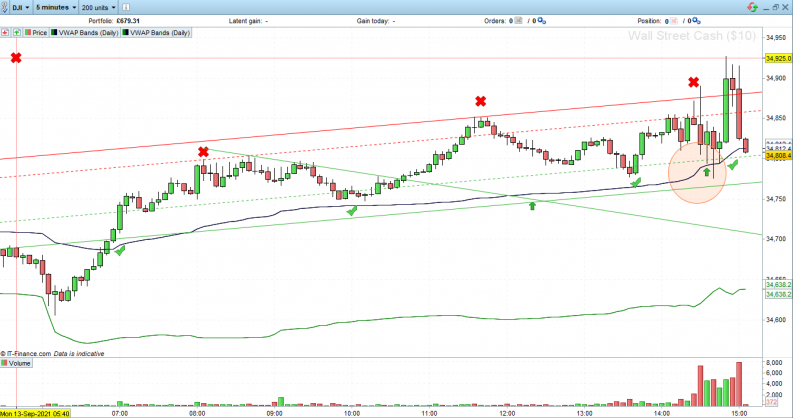
DJIA – Upward Momentum Confirmed by VWAP
Source: IG
YOUR CAPITAL IS AT RISK
Trading Using VWAP in Different Market Conditions
Uptrends
The Dow Jones Industrial Average time interval has been set to five-minute candles in the above price chart. Calculating VWAP using five-minute intervals creates the blue line, and it’s possible to see that the market mood can only be described as bullish. At each point, that price drops close to the blue line but soon spikes upwards again. Traders are left with the option of buying anything that looks like a dip or waiting for market sentiment to turn bearish and potentially missing out on the move altogether.
A secondary confirmation is provided by the number of consecutive green candles that form the breakout above the VWAP line. The seven five-minute candles on the left-hand side of the chart represent 35 minutes of buyers overpowering sellers. Such additional indicators are always welcome and, in this instance, give a good indication of which way the market is heading.
While market conditions are bullish, there are periods throughout the trading session when the price moves to levels where it is no longer supported. Then a natural fall in buying activity causes price to fall back down again. These become potential trade exit points for day traders and an opportunity for more active traders to trade the regression and sell short.
It’s possible by using the chart below to see that any long-only traders who bought the dips, the green arrows when the price fell back to the VWAP level, would have made a profit. Those who had bought also sold, or sold short, at the red crosses would have enhanced their returns.
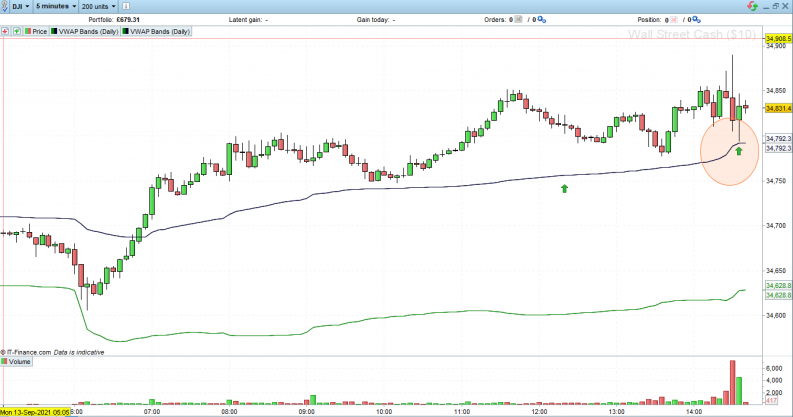
While the market price is trading above the VWAP, the trend is confirmed. However, in our example, the last red candle on the below chart has breached the VWAP line, leaving traders with a decision to make about whether the trend has come to an end or not.
DJIA – Upward Momentum Confirmed by VWAP
Source: IG
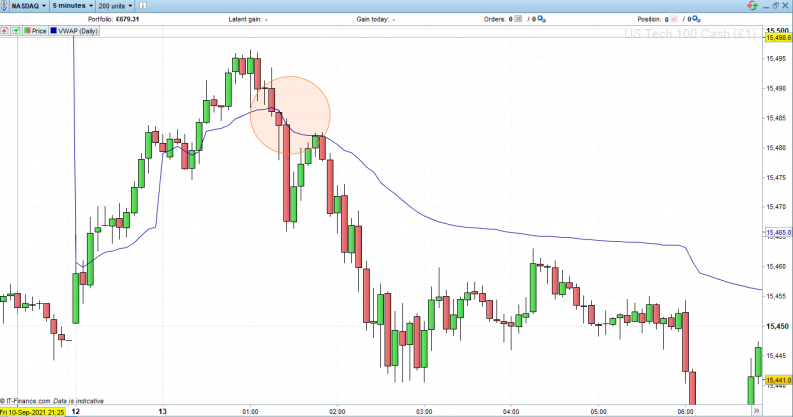
Downtrends
If the market is turning bearish, then a reverse approach would be required. That would involve using the VWAP as a resistance level and selling short, at times, live prices traded near to it. In this instance, we’ve seen only one candle break the VWAP line, so it’s possibly too early to tell if the trend is reversing or not. That raises the question of how to trade using VWAP in markets that aren’t trending in one direction or another.
Nasdaq 100 – Downward Momentum Confirmed by VWAP
Source: IG
YOUR CAPITAL IS AT RISK
Sideways Moving Markets
In directional markets where momentum has signalled a breakout trading pattern, VWAP can be used as a support or resistance line. In sideways trading markets and in the absence of a breakout, the price can be expected to trade either side of VWAP and revert to it as a mean average of that day’s trading. In this scenario, institutional investors can be expected to buy when the price is below the VWAP and sell when it is above. The balance provided by sellers and buyers matching each other in relatively equal measure creates trading opportunities caused by the churning nature of price movement.
VWAP Strategies & Time Periods Soon After Market Open
The cumulative nature of the VWAP formula and the fact that it starts each trading session afresh means that there is some confusion caused right after markets open. There’s not enough recent data to provide a clear steer on market direction. After all, any market momentum can only be confirmed once the price starts to move away from VWAP.
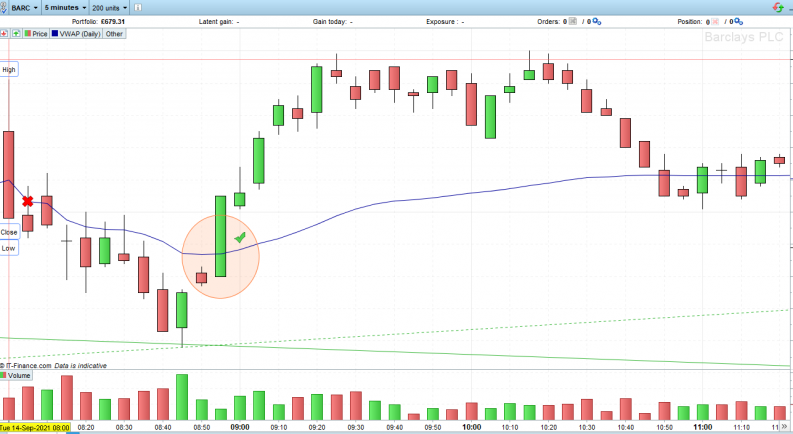
Barclays – Candles at Market Open Intersecting VWAP
Source: IG
The first candle is particularly weak as it has no prior candle to refer to, and during the first few intervals, it can often be the case that price candles overlap VWAP. In the above price chart, six of the first seven candles intersect VWAP at some point during the five minutes. The notable move occurs close to 9.00hrs when the price breaks above VWAP and holds a price level some way above it.
There is also the issue of market open (and market close) being associated with higher trading volumes. Combined, these factors make it hard for analysts to identify the trend and establish whether VWAP will act as a support, resistance, or if the day’s trading will follow a sideways pattern.
One popular strategy is to use five-minute intervals and look for signs of a market trend building 15 minutes after market open. If that is the case, it could indicate a big institutional investor building into a position. Such activity can carry on through the day, meaning the buying or selling activity of that ‘real’ money could be something to tag along with. If momentum fizzles out, then it could be a day to trade a different market where there is some momentum or alternatively try to scalp price moves in a sideways market.
YOUR CAPITAL IS AT RISK
VWAP Strategies & Supporting Indicators
One crucial factor to consider is the benefits of combining signals from a range of different indicators. VWAP is helpful, but a buy or sell signal confirmed by another indicator, such as moving averages or relative strength index, will have a higher probability of being correct.
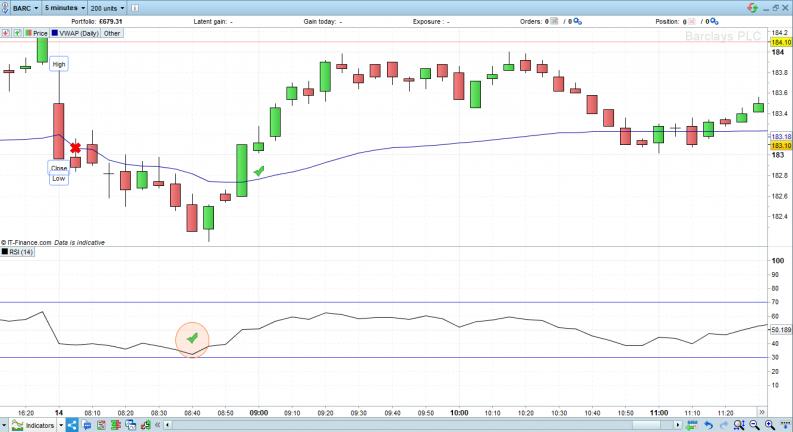
Barclay’s Plc Share Price Chart Using VWAP & RSI
Source: IG
In the above five-minute price chart for Barclays, the RSI reaches a low of the day just before price rebounding. While the 30 RSI level wasn’t quite clipped, the signal that BARC was oversold on a short-term time frame coincided with a break of VWAP 10 minutes later. Used in conjunction, these two indicators provided a more reliable indication of what might be a good trade entry point for a long position.
VWAP Trading Strategy Pros & Cons
| Pros | Cons |
|---|---|
| Objectivity: VWAP removes potential bias by considering both price and volume. | Lagging Indicator: VWAP is calculated based on historical data, making it a lagging indicator. It reflects past activity, not real-time market sentiment. It gives insight into where ‘real’ trading took place, but it still looks backward rather than forwards. |
| Dynamic Support and Resistance: The VWAP line acts as a dynamic support and resistance level, offering entry and exit points. | Limited Applicability: VWAP may be less effective in certain market conditions, such as high volatility or low liquidity. |
| Trend Confirmation and Momentum: VWAP can help confirm trends and identify momentum. When the price consistently trades above or below VWAP, it indicates strong buying or selling pressure. |


