Tesla reports fourth-quarter 2025 results on January 28 after market close. The quarter will determine whether the company’s energy storage and autonomous driving progress can offset sustained automotive margin pressure.
Consensus sits at $0.43 EPS on $24.7B revenue, down 38% and 3% year-over-year respectively, positioning the bar low enough that execution risk lies primarily in forward commentary rather than the quarterly print itself.
The setup reflects a fundamental tension: Tesla delivered record quarterly vehicle volumes (497,099 units in Q4) yet faces consensus EPS estimates that have declined 13.2% over the past 30 days. The estimate revision trajectory underscores how little confidence the Street has in near-term automotive profitability, with regulatory credit sales down 43.6% year-over-year in Q3 and pricing pressure persisting across key markets. The company’s 302x trailing P/E ratio prices in transformation into an AI and robotics platform, not automotive manufacturing economics.
 WELCOME BONUS - Free Share Bundle When You Invest £50!
Get up to £500 cashback for investing with IG.
WELCOME BONUS - Free Share Bundle When You Invest £50!
Get up to £500 cashback for investing with IG.
What the quarter reveals matters less than what management signals about 2026 investment intensity and autonomous driving monetization. Tesla’s Energy Generation and Storage business posted 44% growth in Q3 with gross margins estimated at 31.1% for Q4, providing a credible offset to automotive weakness.
The robotaxi service launched unsupervised operations in Austin in January, removing safety monitors for the first time. These developments frame the debate: whether Tesla can protect margins while funding the transition from car company to technology platform, or whether investment requirements will compress profitability faster than new revenue streams scale.
$1,447.4B
302.2
$0.43
$24.7B
Consensus Estimates
| Metric | Consensus Est. | Range | Prior Guidance | YoY Change |
|---|---|---|---|---|
| EPS (Adjusted) | $0.43 | $0.36 – $0.71 | Not provided | -38.1% |
| Revenue | $24.7B | $23.9B – $28.8B | Not provided | -3.0% |
| Automotive Revenue | $17.3B | N/A | Not provided | Est. -8% |
| Energy Storage Revenue | $3.4B | N/A | Not provided | +44% |
Analysts Covering: 26 (EPS) / 28 (Revenue)
Estimate Revisions (30d): 13 up / 0 down
The consensus EPS estimate of $0.43 represents a 38% decline from Q4 2024’s $0.73, the sharpest year-over-year compression in Tesla’s recent history. The estimate range spans from $0.36 to $0.71, a 97% variance that reflects fundamental disagreement about automotive gross margin trajectory and the sustainability of energy storage growth. Revenue consensus at $24.7B sits roughly 3% below prior year despite Q4 deliveries reaching record levels, indicating the Street expects average selling prices and mix to deteriorate more than volume can offset.
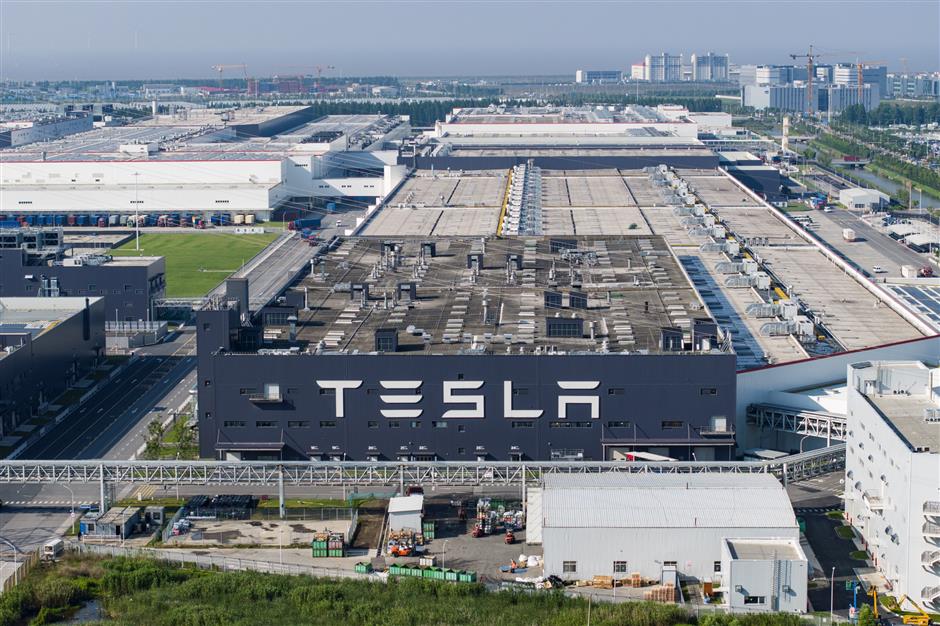
Tesla’s Gigafactory Shanghai represents the company’s global manufacturing scale as it faces margin pressure in key markets
The 13.2% downward revision in consensus over the past 30 days occurred despite 13 upward revisions and zero downward revisions, a mathematical artifact of estimate range compression toward the lower bound. The revision pattern suggests analysts are converging on a conservative baseline that assumes automotive gross margins excluding credits fall below 15%, down from 17.1% in Q3 2024. Energy storage revenue at $3.4B would represent 14% of total revenue, up from 9% a year ago, marking the segment’s emergence as a material earnings contributor with structurally higher margins than automotive.
Management Guidance and Commentary
Tesla does not provide traditional quarterly guidance ranges for revenue, EPS, or gross margin. The company’s forward-looking commentary focuses on production capacity, delivery targets, and investment priorities rather than near-term financial metrics. This approach shifts the burden of expectation-setting entirely to the Street and makes quarterly calls critical for understanding management’s view of demand elasticity and margin trajectory.
“We are focused on making our vehicles more affordable while continuing to invest in autonomy and AI. The robotaxi service launch in Austin represents the beginning of what we believe will be our largest business opportunity.”
Management’s Q2 commentary emphasized the transition toward autonomy and robotics as primary revenue drivers, explicitly positioning automotive manufacturing as a means to an end rather than the core business. The framing matters because it signals willingness to sacrifice near-term automotive margins to fund AI development and scale autonomous operations. Tesla’s decision to transition Full Self-Driving to subscription-only in February 2026 eliminates the $8,000-$12,000 upfront purchase option, creating a recurring revenue stream but potentially limiting adoption among price-sensitive buyers.
“Energy storage deployments reached record levels in Q3, and we expect continued strong growth as grid storage demand accelerates globally.”
The energy storage commentary provides the clearest positive signal in recent quarters. Tesla deployed 14.2 GWh in Q4, up from 9.4 GWh in Q3, with gross margins estimated at 31.1% compared to automotive margins in the high teens. The segment’s growth rate and margin profile make it the most credible near-term offset to automotive pressure, though at $3.4B quarterly revenue it remains too small to fully compensate for automotive weakness.
The gap between consensus revenue of $24.7B and Q4 2024’s $25.7B reflects the Street’s assumption that Tesla cannot hold pricing while refreshing the Model Y and ramping the lower-cost vehicle platform. Management has not provided specific 2026 delivery guidance beyond signaling production of the affordable model would begin in the second half of 2025, leaving analysts to extrapolate from capacity utilization and historical ramp curves. The absence of formal guidance creates asymmetric risk: any quantified 2026 outlook below 1.8 million deliveries would likely pressure the stock, while maintaining ambiguity allows the market to price in optimistic scenarios without management accountability.
Analyst Price Targets & Ratings
Wall Street sentiment has shifted markedly bearish, with only 43% of analysts rating shares a Buy or Strong Buy compared to 84% for Micron. The consensus target of $411.40 implies 5.5% downside from current levels, reflecting skepticism about Tesla’s ability to maintain its valuation premium while automotive margins compress. The Hold-heavy rating distribution suggests analysts view the stock as fairly valued at current levels but see limited upside without fundamental improvement in either automotive profitability or autonomous driving monetization.
Sector & Peer Comparison
| Company | Ticker | Market Cap | P/E | Fwd P/E | Profit Margin |
|---|---|---|---|---|---|
|
Tesla Inc
⭐ Focus |
TSLA | $1,447.4B | 302.2 | 200.6 | 5.3% |
|
Toyota Motor
|
TM | $318.2B | 9.1 | 8.7 | 9.8% |
|
BYD Company
|
BYDDY | $112.4B | 28.3 | 18.2 | 5.1% |
|
General Motors
|
GM | $58.7B | 5.2 | 4.8 | 7.4% |
|
Ford Motor
|
F | $43.1B | 6.1 | 6.3 | 3.2% |
|
Rivian Automotive
|
RIVN | $12.8B | N/A | N/A | -38.7% |
|
Lucid Group
|
LCID | $8.2B | N/A | N/A | -112.3% |
Tesla trades at a 302x trailing P/E and 201x forward P/E, multiples that bear no relationship to automotive manufacturing economics. The valuation premium to Toyota (9x P/E, 9.8% profit margin) and BYD (28x P/E, 5.1% margin) reflects the market’s willingness to value Tesla as a technology platform rather than a car company. The forward P/E of 201x implies 2026 EPS of $2.17, requiring either significant margin expansion or revenue growth well above current delivery projections.
The peer set reveals Tesla’s structural challenge: traditional automakers trade at single-digit multiples with higher profit margins, while pure-play EV competitors like Rivian and Lucid remain unprofitable. Tesla sits in the middle with automotive margins under pressure but a market capitalization that assumes transformation into a fundamentally different business. The company’s 5.3% profit margin matches BYD’s but trails Toyota’s 9.8% and GM’s 7.4%, undermining the narrative that Tesla possesses superior manufacturing efficiency.
BYD’s 28x P/E at similar margins to Tesla suggests the market assigns limited value to pure EV exposure without a credible autonomy or AI story. Tesla’s premium requires belief that robotaxis, FSD subscriptions, and Optimus robots will generate margins and growth rates that justify a 10x multiple to BYD. The gap between Tesla’s current profit margin (5.3%) and the 15-20% margins required to support a 200x forward P/E represents the execution risk embedded in the valuation.
Earnings Track Record
| Quarter | EPS Actual | EPS Est. | Result | Surprise % |
|---|---|---|---|---|
| Q3 2025 | $0.50 | $0.55 | Miss | -9.1% |
| Q2 2025 | $0.40 | $0.43 | Miss | -7.0% |
| Q1 2025 | $0.27 | $0.39 | Miss | -30.8% |
| Q4 2024 | $0.73 | $0.76 | Miss | -3.9% |
| Q3 2024 | $0.62 | $0.50 | Beat | +24.0% |
| Q2 2024 | $0.52 | $0.56 | Miss | -7.1% |
| Q1 2024 | $0.45 | $0.51 | Miss | -11.8% |
| Q4 2023 | $0.71 | $0.74 | Miss | -4.1% |
Tesla has missed EPS estimates in each of the last four reported quarters, with an average miss of 12.7% over that period. The Q1 2025 miss of 30.8% marked an inflection point, forcing analysts to reset expectations around automotive demand elasticity and margin sustainability. The pattern reveals a company whose quarterly execution consistently falls short of Street models, with only one beat (Q3 2024’s 24% surprise) in the trailing eight quarters.
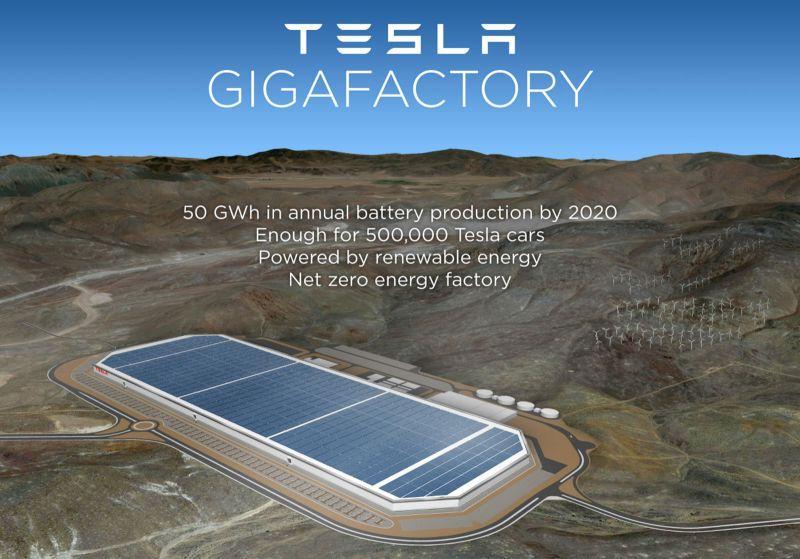
Tesla’s Gigafactory concept emphasizes renewable energy integration as the company transitions toward AI and robotics platforms
The 55% beat rate over 20 quarters masks deteriorating recent performance. Tesla beat or met estimates in 7 of 8 quarters from Q1 2023 through Q2 2024, then missed in 4 consecutive quarters through Q3 2025. The shift coincides with the end of the post-pandemic demand surge and intensifying competition in key EV markets, particularly China where BYD has gained share. The average surprise of just 0.2% over the full period indicates Tesla typically delivers close to expectations when execution is clean, making the recent string of misses more significant.
Post-Earnings Price Movement History
| Date | Surprise | EPS vs Est. | Next Day Move | Price Change |
|---|---|---|---|---|
| Q3 2025 | -9.1% | $0.50 vs $0.55 | +3.7% | $443.21 to $459.46 |
| Q2 2025 | +10.0% | $0.40 vs $0.43 | -7.1% | $323.63 to $300.71 |
| Q1 2025 | -30.8% | $0.27 vs $0.39 | +1.9% | $263.55 to $268.46 |
| Q4 2024 | -3.9% | $0.73 vs $0.76 | -9.1% | $417.41 to $379.28 |
| Q3 2024 | +24.0% | $0.62 vs $0.50 | -0.9% | $260.46 to $258.02 |
Tesla’s post-earnings price reactions show no consistent correlation between EPS surprise direction and next-day stock movement. The Q2 2025 beat of 10% resulted in a 7.1% decline, while the Q1 2025 miss of 30.8% produced a 1.9% gain. The pattern indicates forward guidance and management commentary drive the stock more than the reported quarter’s results, consistent with a valuation that prices in future transformation rather than current earnings power.
Expected Move & Implied Volatility
48.2%
62%
42.1%
The options market prices a 5% move in either direction, translating to a range of $413 to $457 for the day following earnings. The implied volatility of 48.2% sits in the 62nd percentile of its one-year range, indicating options traders see this event as moderately more uncertain than typical but not at extreme levels. The 30-day historical volatility of 42.1% running below implied volatility suggests the market expects the earnings event to generate above-normal movement.
Expert Predictions & What to Watch
Key Outlook: Cautiously Bearish
The base case assumes Tesla reports EPS between $0.43 and $0.48 on revenue of $24.5B to $25.2B, with automotive gross margins excluding credits in the 14-16% range. Energy storage revenue likely exceeds $3.4B with gross margins above 30%, providing a margin tailwind that partially offsets automotive pressure. The quarter itself matters less than management’s framing of 2026 investment requirements and autonomous driving monetization timelines.
Key Metrics to Watch
The automotive gross margin excluding credits represents the single most important metric because it determines Tesla’s ability to self-fund the transition to an AI and robotics company. Margins below 14% would force difficult capital allocation choices between returning cash to shareholders, maintaining investment intensity, or raising additional capital. The energy storage business provides a partial offset but cannot fully compensate at current scale.
Management’s 2026 guidance will matter more than Q4 results. The market needs confidence that Tesla can grow deliveries to 1.8 million units or higher while maintaining margins and funding AI development. Any signal that 2026 will require elevated capex without corresponding revenue growth would pressure the stock regardless of Q4 performance. The robotaxi scaling timeline matters because it represents the primary justification for Tesla’s valuation premium to traditional automakers and pure-play EV competitors.
Searching for the Perfect Broker?
Supplement your charting with a free trading platform that rivals the best out there – multiple charts on one screen for easy monitoring, ProRealTime provides the perfect support for your investing or trading journey.
Discover our top-recommended brokers for trading stocks, forex, cryptos, and beyond. Dive in and test their capabilities with complimentary demo accounts today!
- IG Top-tier regulation – Read our Review
- eToro Wide range of instruments available to trade – Read our Review
YOUR CAPITAL IS AT RISK. 76% OF RETAIL CFD ACCOUNTS LOSE MONEY

