Intuitive Surgical’s stock price (NASDAQ:ISRG) has fallen below the $550 support level in recent sessions, trading 9.68% lower over the past month at $523.69 ahead of earnings.
The company reports fourth-quarter 2025 results after market close, following a January 14 preliminary release that set Q4 revenue at approximately $2.87B and introduced 2026 da Vinci procedure growth guidance of 13% to 15%.
The preliminary figures exceeded the prior FactSet consensus of $2.72B, but shares declined 2.7% on the announcement as investors focused on the moderated 2026 growth outlook versus the 18% procedure growth achieved in Q4 2025. Consensus now sits at $1.99 EPS and $2.41B revenue for Q3 2025, the last fully reported quarter, with the company having beaten adjusted EPS estimates by an average of 16% over the trailing four quarters.
The setup for Thursday’s call is whether management tightens or raises the 2026 procedure growth range above the 14% midpoint, and whether gross margin guidance incorporates the tariff moderation trajectory that lifted FY25 non-GAAP gross margin from an initial 67.5% midpoint to 67.3% by Q3. The stock trades at 69.5x trailing P/E and 55.2x forward estimates, a premium that requires sustained execution on both procedure volume and margin expansion to justify current multiples.
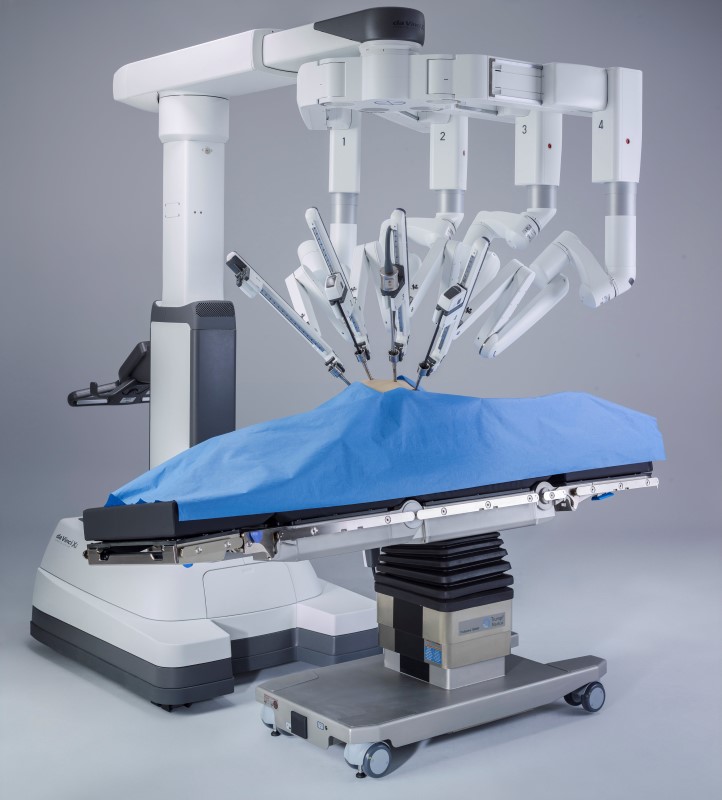
With 303 da Vinci 5 systems placed in Q4 alone at average selling prices above $1.6M, the near-term revenue driver is clear; the constraint is whether hospital capital budgets globally can sustain the placement pace and whether utilization growth offsets any system revenue lumpiness.
$187.7B
69.5
$1.99
$2.41B
Consensus Estimates
| Metric | Consensus Est. | Range | YoY Change |
|---|---|---|---|
| EPS (Adjusted) | $1.99 | $1.85 – $2.11 | +8.1% |
| Revenue | $2.41B | $2.35B – $2.47B | +18.4% |
| Instruments & Accessories | $1.65B | N/A | +16.7% |
| Systems Revenue | $660.6M | N/A | +0.9% |
| Services Revenue | $403.4M | N/A | +16.1% |
Analysts Covering: 24 analysts (EPS), 18 analysts (Revenue)
Estimate Revisions (30d): 0 up / 0 down
Consensus for Q3 2025 (the last fully reported quarter) reflects stable expectations with zero revisions in the past 30 days, suggesting analysts are waiting for the full Q4 results and 2026 guidance before adjusting models. The preliminary Q4 revenue figure of $2.87B implies sequential acceleration from Q3’s $2.51B, driven by the 303 da Vinci 5 system placements and 18% procedure growth disclosed in the January 14 release. The instruments and accessories segment, which generates the highest-margin recurring revenue, is expected to grow 16.7% year-over-year, consistent with the procedure volume trajectory and installed base expansion.
The estimate range for Q3 EPS spans $1.85 to $2.11, a 26-cent spread that reflects uncertainty around gross margin outcomes given tariff exposure and product mix effects from da Vinci 5 ramp costs. Systems revenue growth of only 0.9% year-over-year contrasts sharply with the 303 Q4 placements, indicating either conservative Q3 modeling or recognition that system revenue timing can be lumpy depending on lease versus purchase mix. Services revenue growth of 16.1% ties to digital ecosystem adoption and the expanding installed base requiring maintenance contracts.
Management Guidance and Commentary
“Management estimates a nearly 70-basis-point impact on 2025 margins” from tariff pressures, according to Nasdaq analysis of the company’s third-quarter earnings call commentary.
Intuitive’s FY25 non-GAAP gross margin guidance evolved across the year from an initial 67.5% midpoint in January 2025 to 65.8% by April (incorporating tariff assumptions), then rebuilding to 66.5% in July and 67.3% by October as estimated tariff impacts moderated. The company’s ability to recover 150 basis points of margin guidance between April and October 2025 signals either improved manufacturing efficiency, better-than-expected tariff outcomes, or favorable product mix as da Vinci 5 volumes scaled. The January 14 preliminary release provided no explicit FY26 gross margin range, leaving Thursday’s call as the first opportunity for management to frame 2026 margin expectations against the 67.3% FY25 exit rate.
“The company also outlined plans for more measured da Vinci procedure growth of 13% to 15% in 2026, even as newly cleared da Vinci 5 and expanding Ion usage highlight its effort to balance innovation with hospital capital and budget constraints globally,” per Simply Wall St coverage of the preliminary release.
The 13% to 15% procedure growth guidance for 2026 (midpoint 14%) represents a deliberate step-down from the 18% Q4 2025 growth rate and the 17% to 17.5% FY25 full-year range management provided in October. This framing suggests either conservative positioning consistent with Intuitive’s historical practice of setting beatable bars, or genuine concern about hospital capital budget constraints limiting system placements and utilization growth. The gap between the 14% midpoint and Street expectations that had been running higher is the primary reason for the 2.7% stock decline on the preliminary release. Investors will parse Thursday’s commentary for signals on whether the 13% to 15% range reflects caution or a true deceleration in underlying demand.
Analyst Price Targets & Ratings
Wall Street maintains a bullish stance with 79% of analysts rating shares a Buy or Strong Buy. The consensus target of $608.26 implies 16% upside from current levels, though the moderated 2026 growth guidance has introduced some caution among analysts who previously expected sustained 15%+ procedure growth.
Sector & Peer Comparison
| Company | Ticker | Market Cap | P/E | Fwd P/E | Profit Margin |
|---|---|---|---|---|---|
|
Intuitive Surgical Inc
⭐ Focus |
ISRG | $187.7B | 69.5 | 55.2 | 28.6% |
|
Medtronic plc
|
MDT | $113.2B | 28.4 | 15.8 | 15.2% |
|
Stryker Corporation
|
SYK | $129.8B | 42.1 | 28.3 | 16.8% |
|
Boston Scientific Corp
|
BSX | $128.5B | 68.2 | 32.1 | 13.4% |
|
Edwards Lifesciences
|
EW | $44.6B | 38.7 | 24.5 | 24.1% |
Intuitive trades at a 144% premium to the medical device peer group on trailing P/E and a 75% premium on forward multiples, justified by its 28.6% profit margin (highest in the comp set) and 30.3% operating margin. The forward P/E of 55.2x compares to an industry average of 30.0x, embedding expectations for sustained double-digit procedure growth and margin expansion that peers cannot match. Medtronic, the largest diversified device company, trades at 15.8x forward earnings despite comparable scale, reflecting its exposure to lower-margin product lines and slower growth. Boston Scientific’s 68.2x trailing P/E approaches Intuitive’s multiple but its 13.4% profit margin and 32.1x forward P/E indicate the market prices BSX for growth acceleration rather than current profitability.
The valuation premium requires Intuitive to deliver on both the procedure growth algorithm (14% midpoint for 2026) and margin trajectory (maintaining or expanding from the 67.3% FY25 non-GAAP gross margin exit rate). A miss on either dimension would compress the multiple toward the 40x to 45x range where high-quality medtech growth names typically trade. The 28.6% profit margin provides cushion, but the 69.5x trailing P/E leaves limited room for execution variance or guidance disappointment.
Earnings Track Record
| Quarter | EPS Actual | EPS Est. | Result | Surprise % |
|---|---|---|---|---|
| Q3 2025 | $2.40 | $1.99 | Beat | +20.6% |
| Q2 2025 | $2.19 | $1.92 | Beat | +14.1% |
| Q1 2025 | $1.81 | $1.73 | Beat | +4.6% |
| Q4 2024 | $2.21 | $1.79 | Beat | +23.5% |
| Q3 2024 | $1.84 | $1.64 | Beat | +12.2% |
| Q2 2024 | $1.78 | $1.54 | Beat | +15.6% |
| Q1 2024 | $1.50 | $1.41 | Beat | +6.4% |
| Q4 2023 | $1.60 | $1.48 | Beat | +8.1% |
Intuitive has beaten adjusted EPS estimates in each of the last ten reported quarters, with an average surprise of 16.3% and a five-year beat rate of 80%. The most recent Q3 2025 result delivered a 20.6% beat ($2.40 versus $1.99 consensus), the largest surprise in the trailing twelve months. This pattern of consistent beats suggests the Street systematically underestimates near-term earnings power, though stock reactions have been mixed depending on guidance framing. Q4 2024 produced a 23.5% EPS beat but shares declined 2.2% in extended trading as management introduced a lower FY25 procedure growth outlook and reduced gross margin guidance.
The beat pattern held even through quarters where margin guidance was under pressure. Q1 2025 beat by 4.6% despite management cutting the FY25 non-GAAP gross margin range to 65% to 66.5% and warning that additional tariffs could have a material impact; shares fell 2.3% after-hours on that language. Q2 2025 beat by 14.1% and raised margin guidance to 66% to 67%, yet still declined 1.5% in extended trading. Only Q3 2025, which combined a 20.6% beat with raised procedure growth guidance (17% to 17.5%) and improved margin outlook (67% to 67.5%), generated a positive reaction (up 17% in extended trading). The track record indicates that beating the quarterly number is necessary but not sufficient; the stock moves on guidance and margin trajectory.
Post-Earnings Price Movement History
| Date | Result | EPS vs Est. | Next Day Move | Price Change |
|---|---|---|---|---|
| Q4 2025 | Prelim Release | N/A | -1.9% | $572.63 → $561.98 |
| Q3 2025 | +20.6% | $2.40 vs $1.99 | -0.3% | $439.22 → $438.04 |
| Q2 2025 | +14.1% | $2.19 vs $1.92 | +0.8% | $533.71 → $537.99 |
| Q1 2025 | +4.6% | $1.81 vs $1.73 | +0.9% | $491.84 → $496.36 |
| Q4 2024 | +23.5% | $2.21 vs $1.79 | -0.6% | $526.96 → $524.03 |
| Q3 2024 | +12.2% | $1.84 vs $1.64 | +1.2% | $479.18 → $484.76 |
Next-day price reactions have been muted despite consistent EPS beats, with an average move of 0.0% and a median of +0.3%. Beats generate an average +0.4% move, while the single miss in the dataset (Q4 2025 preliminary release, which was not a traditional earnings report) produced a -1.9% decline. The pattern reveals that the market prices guidance and margin outlook more heavily than the quarterly beat itself. Q4 2024 delivered a 23.5% EPS beat but declined 0.6% the next day after management introduced lower FY25 procedure growth guidance. Q3 2025 beat by 20.6% yet fell 0.3% the next day despite raising full-year guidance, suggesting profit-taking after the extended-hours 17% surge.
The largest positive next-day move in the recent dataset was +1.2% following Q3 2024, which beat by 12.2% and raised guidance. The smallest positive move was +0.8% after Q2 2025, which beat by 14.1% and lifted margin guidance but still faced skepticism given the tariff overhang earlier in the year. This history suggests Thursday’s reaction will hinge on whether the 2026 procedure growth guidance of 13% to 15% is tightened upward or remains at the conservative midpoint, and whether management provides a credible path to margin expansion beyond the 67.3% FY25 exit rate.
Expected Move & Implied Volatility
28.5%
62%
24.1%
The options market implies a ±4.2% move through earnings, significantly above the 0.0% average historical next-day reaction and the +0.4% average on beats. Implied volatility of 28.5% sits at the 62nd percentile of the trailing year’s range and runs 440 basis points above 30-day historical volatility of 24.1%, indicating elevated uncertainty priced into near-term options. The $501.70 to $545.68 expected range brackets the current $523.69 price with asymmetric skew; a move to the lower bound would represent a 4.2% decline, while the upper bound implies a 4.2% gain.
The elevated IV relative to historical volatility suggests options traders are pricing greater risk around Thursday’s call than the stock’s recent trading pattern would imply. This setup is consistent with the preliminary release having already moved the stock (down 2.7% on January 14), leaving the full earnings call to either validate that cautious 2026 framing or provide upside surprise through tighter guidance or improved margin visibility. The 62nd percentile IV rank indicates options are moderately expensive but not at extreme levels, leaving room for further volatility expansion if guidance disappoints or compression if management raises the 2026 outlook.
Expert Predictions & What to Watch
Key Outlook: Cautiously Neutral
The case for neutrality rests on the tension between strong Q4 execution (19% revenue growth, 303 system placements, 18% procedure growth) and the moderated 2026 outlook that has already pressured the stock. If management maintains the 13% to 15% procedure growth range without providing a credible path to margin expansion beyond the 67.3% FY25 exit rate, the stock faces multiple compression toward the 50x to 55x forward P/E range where high-quality medtech growth names trade when growth decelerates. Conversely, if the company tightens 2026 guidance to 14% to 16% or provides explicit gross margin targets above 67.5%, the premium valuation can be defended on the basis of sustained double-digit growth and operating leverage.
Key Metrics to Watch
The 2026 procedure growth guidance carries the highest weight because it directly determines the revenue algorithm that justifies the valuation premium. A tightened range to 14% to 16% would imply management sees upside to the initial conservative 14% midpoint, likely driven by stronger-than-expected da Vinci 5 adoption or international market resilience. Conversely, maintaining the 13% to 15% range without upward bias would signal genuine concern about hospital capital budgets and utilization constraints, forcing a re-rating of the growth trajectory.
Gross margin guidance for FY26 is the second critical variable. The company recovered 150 basis points of margin guidance between April and October 2025 as tariff impacts moderated and manufacturing scaled. Providing an explicit FY26 range above 67.5% would demonstrate that the margin recovery is sustainable and that da Vinci 5 manufacturing costs are declining as volumes ramp. Failure to provide a range, or guiding below 67%, would raise questions about whether tariff pressures are re-emerging or whether product mix effects from ASC expansion are pressuring profitability.

Q4 system placements and average selling prices will validate the preliminary revenue figure and provide insight into the lease versus purchase mix. The 303 systems disclosed in the preliminary release represent strong demand, but investors will want confirmation that ASPs held above $1.6M and that the placement pace is sustainable into 2026. Any commentary suggesting ASPs are declining or that hospitals are shifting toward lease structures (which defer revenue recognition) would pressure near-term revenue expectations.
Instruments and accessories revenue per procedure at $1,800 or higher would confirm that the recurring revenue engine is intact and that pricing power remains despite China pressures and ASC expansion. This segment generates the highest margins and drives earnings leverage; contraction below $1,750 would signal either pricing pressure or unfavorable mix that could offset system revenue growth. Ion platform revenue per procedure at $2,200 provides diversification, but the base is still small relative to da Vinci; investors will watch for signals that Ion adoption is accelerating beyond the current run rate.
International market commentary will determine whether the 14% global procedure growth midpoint is achievable. China pricing pressure has been acknowledged by management; worsening trends there would pressure the international growth contribution. Europe and Japan face macroeconomic budget constraints that are limiting da Vinci 5 rollouts; any indication that these constraints are intensifying would undermine confidence in the 2026 outlook. Conversely, commentary suggesting China pricing is stabilizing or that European budgets are loosening would support the case for sustained international growth.
Searching for the Perfect Broker?
Supplement your charting with a free trading platform that rivals the best out there – multiple charts on one screen for easy monitoring, ProRealTime provides the perfect support for your investing or trading journey.
Discover our top-recommended brokers for trading stocks, forex, cryptos, and beyond. Dive in and test their capabilities with complimentary demo accounts today!
- IG Top-tier regulation – Read our Review
- eToro Wide range of instruments available to trade – Read our Review
YOUR CAPITAL IS AT RISK. 76% OF RETAIL CFD ACCOUNTS LOSE MONEY


