Western Digital’s stock (NASDAQ: WDC) has been one of the bull stories of the year, up 47.75% YTD, with less than 1 month of the year complete.
The stock price hit new highs at $285.42 today, with earnings on deck after the close. Expectations for the quarter sits at $1.93 EPS and $2.94B revenue, below management’s prior midpoint guide of $1.88 EPS and $2.90B revenue, creating a setup where meeting guidance could be interpreted as a modest beat while any shortfall would challenge the stock’s premium valuation.
The report arrives with the stock trading at 39.4x trailing earnings and 17.6% above the average analyst price target, a valuation premium that reflects investor conviction in the AI-driven data storage thesis. Seagate’s strong December quarter, which showed 22% revenue growth and record margins, has reinforced sector optimism and driven WDC shares up 11% in the session following that report. The key question is whether Western Digital can validate the pricing discipline and cloud demand visibility that management signaled in October when it guided fiscal Q2’26 to 44-45% non-GAAP gross margin.
The outcome will determine whether the stock’s re-rating from a cyclical storage supplier to an AI infrastructure beneficiary can be sustained. If results and guidance confirm durable margin expansion and long-dated customer commitments, the valuation gap to consensus targets may narrow through upward estimate revisions.
If execution merely meets the midpoint without raising the forward trajectory, the stock faces asymmetric downside risk given its position above analyst targets and the market’s tendency to punish guidance caution after strong runs.
$95.88B
39.4
$1.93
$2.94B

Western Digital Corporation, a leading data storage technology company serving cloud infrastructure and enterprise markets
Consensus Estimates
| Metric | Consensus Est. | Range | Prior Guidance | YoY Change |
|---|---|---|---|---|
| EPS (Adjusted) | $1.93 | $1.87 – $2.05 | $1.88 (midpoint) | +8.9% |
| Revenue | $2.94B | $2.90B – $3.11B | $2.90B (midpoint) | -31.5% |
| Gross Margin | 44.5% | 44.0% – 45.0% | 44-45% (guided) | +150 bps |
Analysts Covering: 18 (EPS) / 19 (Revenue)
Estimate Revisions (30d): 7 up / 0 down
Consensus expectations have firmed in the past 30 days, with seven upward EPS revisions and no downward adjustments, reflecting confidence that Western Digital can sustain the profitability trajectory established over the past three quarters. The $1.93 consensus EPS sits modestly above management’s $1.88 midpoint guide, while the $2.94B revenue estimate aligns closely with the $2.90B midpoint. This tight positioning means execution at the guided midpoint would likely be received neutrally, while any beat would need to be accompanied by raised forward guidance to drive meaningful upside.
The year-over-year revenue decline of 31.5% reflects the company’s business separation process and is not a clean comparison. More relevant is the sequential trajectory: fiscal Q1’26 delivered $2.82B revenue, implying 4.3% quarter-over-quarter growth at the consensus midpoint. The critical metric is gross margin, where the 44-45% guided range represents a 150 basis point improvement year-over-year and would mark the fourth consecutive quarter of margin expansion. Sustaining this trajectory depends on continued pricing discipline in the nearline HDD market and favorable mix toward cloud customers.
Management Guidance and Commentary
“We are pleased with our strong start to fiscal 2026, driven by continued strength in cloud demand and improved pricing dynamics in our nearline HDD business. Our focus remains on executing our technology roadmap and capturing the significant opportunities presented by AI-driven data growth.”
Management’s October guidance established a fiscal Q2’26 midpoint of $2.90B revenue and $1.88 non-GAAP EPS, with non-GAAP gross margin expected at 44-45%. This represented a continuation of the margin expansion story that has defined the past year: fiscal Q1’26 delivered 43.6% gross margin, up from 38.0% in the year-ago quarter. The guidance implied that pricing and mix improvements were sustainable rather than transitory, a critical signal given the stock’s re-rating from cyclical supplier to AI beneficiary.
The gap between guidance and consensus has narrowed since October. At the time of the fiscal Q1’26 report, Street expectations sat at $2.82B revenue and $1.71 EPS, both below the guided midpoint. Current consensus of $2.94B revenue and $1.93 EPS now sits modestly above that midpoint, suggesting the market has priced in execution at or slightly above the guided range. This creates a higher bar: simply delivering the midpoint may not be sufficient to sustain momentum, particularly given the stock’s 49.4% gain in the past month alone.
The forward setup hinges on whether management can tighten the revenue range upward or raise the gross margin outlook. Historical patterns show that guidance tone matters more than backward-looking beats. Fiscal Q2’25 delivered revenue roughly in line with expectations but guided fiscal Q3’25 below Street views, forcing a wholesale reset of estimates and driving shares down in after-hours trading. Conversely, fiscal Q3’25 and fiscal Q1’26 both paired solid results with above-consensus guidance, driving positive stock reactions. The January 29 report will be evaluated primarily on what management signals for the March quarter and full fiscal 2026.
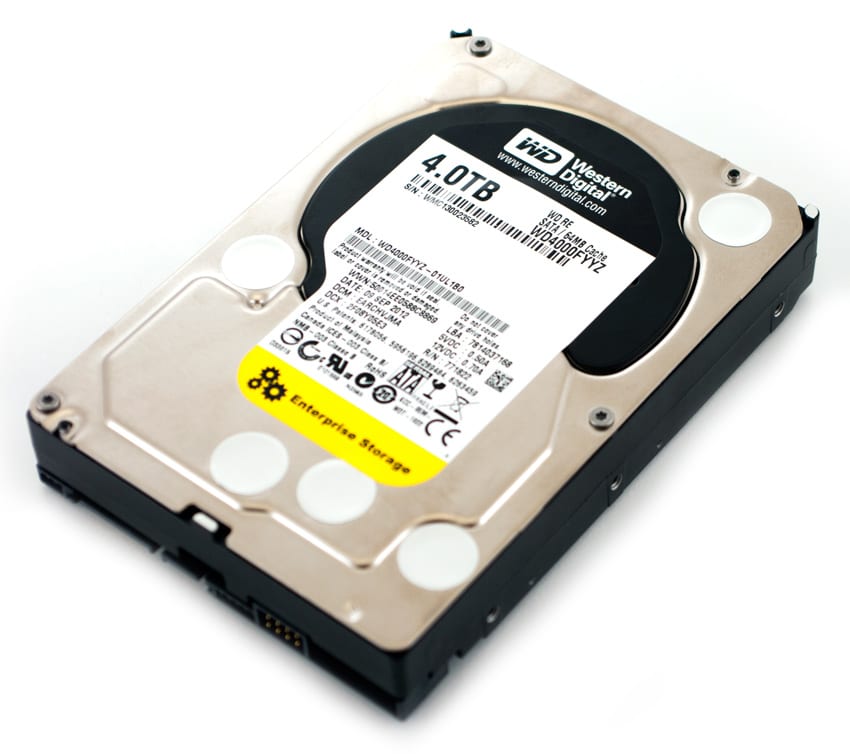
Western Digital’s high-capacity enterprise hard drives power cloud data centers and AI infrastructure deployments worldwide
Analyst Price Targets & Ratings
Wall Street maintains a generally positive outlook with 76% of analysts rating shares a Buy or Strong Buy, though the consensus target of $229.38 sits 17.6% below current levels. This disconnect reflects the speed of the stock’s recent advance—shares have gained 49.4% in the past month alone, outpacing analyst target adjustments. The lack of Sell ratings suggests fundamental confidence in the AI storage thesis, but the valuation gap indicates caution about near-term execution risk.
Sector & Peer Comparison
| Company | Ticker | Market Cap | P/E | Fwd P/E | Profit Margin |
|---|---|---|---|---|---|
|
Western Digital
⭐ Focus |
WDC | $95.88B | 39.4 | 25.7 | 25.5% |
|
Seagate Technology
|
STX | $28.5B | 32.1 | 18.4 | 12.8% |
|
NetApp
|
NTAP | $31.2B | 28.6 | 19.2 | 18.4% |
|
Pure Storage
|
PSTG | $22.8B | 78.2 | 42.1 | 8.6% |
|
Dell Technologies
|
DELL | $89.4B | 18.3 | 12.8 | 5.2% |
Western Digital trades at a 53% premium to Seagate on forward P/E (25.7x vs 18.4x) and commands a profit margin nearly double that of its primary HDD competitor (25.5% vs 12.8%). This valuation gap reflects the market’s view that Western Digital’s vertically integrated manufacturing and cloud customer mix position it to capture a disproportionate share of AI-driven storage demand. The 39.4x trailing P/E multiple is elevated relative to the broader storage peer group, exceeded only by Pure Storage’s 78.2x multiple, which is supported by that company’s pure-play flash storage positioning.
The premium to Seagate is particularly notable given the duopoly structure of the nearline HDD market. Both companies benefit from the same demand drivers and pricing dynamics, yet Western Digital’s margin profile has re-rated more aggressively. The 25.5% profit margin compares favorably to NetApp’s 18.4% and Dell’s 5.2%, suggesting operational leverage that justifies a higher multiple. However, sustaining this premium requires continued evidence that margin expansion is structural rather than cyclical.
Earnings Track Record
| Quarter | EPS Actual | EPS Est. | Result | Surprise % |
|---|---|---|---|---|
| 2025-09-30 | $3.07 | $1.45 | Beat | +111.7% |
| 2025-06-30 | $1.66 | $1.48 | Beat | +12.2% |
| 2025-03-31 | $1.36 | $1.11 | Beat | +22.5% |
| 2024-12-31 | $1.77 | $1.82 | Miss | -2.7% |
| 2024-09-30 | $1.78 | $1.71 | Beat | +4.1% |
| 2024-06-30 | $1.44 | $1.17 | Beat | +23.1% |
| 2024-03-31 | $0.63 | $0.21 | Beat | +200.0% |
| 2023-12-31 | -$0.69 | -$1.13 | Beat | +38.9% |
Western Digital has beaten consensus EPS estimates in 14 of the past 18 quarters, establishing a 77.8% beat rate with an average surprise of 7.4%. The pattern shifted notably beginning in March 2024, when the company emerged from a cyclical trough and began delivering consistent profitability beats. The most recent quarter (September 2025) produced a 111.7% surprise, though this magnitude was partly driven by conservative estimates during the business separation process rather than pure operational outperformance.
The December 2024 quarter stands as the only miss in the past two years, and notably, the stock rose 3.8% the following day despite the -2.7% EPS shortfall. This reaction pattern underscores that guidance matters more than backward-looking results. When Western Digital has paired beats with above-consensus forward guidance (as in fiscal Q3’25 and Q1’26), shares have rallied. When results meet expectations but guidance disappoints (fiscal Q2’25), the stock has sold off. The upcoming report will be evaluated primarily on whether management can sustain the margin expansion narrative through forward commentary.
Post-Earnings Price Movement History
| Date | Surprise | EPS vs Est. | Next Day Move | Price Change |
|---|---|---|---|---|
| 2025-09-30 | +111.7% | $3.07 vs $1.45 | +11.9% | $116.74 → $130.59 |
| 2025-06-30 | +12.2% | $1.66 vs $1.48 | +0.9% | $63.29 → $63.84 |
| 2025-03-31 | +22.5% | $1.36 vs $1.11 | +0.7% | $40.62 → $40.89 |
| 2024-12-31 | -2.7% | $1.77 vs $1.82 | +3.8% | $59.60 → $61.85 |
| 2024-09-30 | +4.1% | $1.78 vs $1.71 | -3.8% | $69.40 → $66.74 |
Western Digital’s post-earnings price reactions have averaged +3.3% over recent quarters, with the magnitude of the move correlating more strongly to guidance tone than to the size of the EPS beat. The September 2025 quarter produced the largest reaction (+11.9%) following a 111.7% EPS surprise and above-consensus forward guidance. Conversely, the September 2024 quarter saw shares decline 3.8% despite a 4.1% EPS beat, driven by cautious forward commentary that disappointed investors.
The December 2024 quarter provides the clearest template for how the market prioritizes guidance over results. Despite missing EPS estimates by 2.7%, shares rose 3.8% the following day because management’s fiscal Q3’25 outlook came in above Street expectations. This pattern suggests that the January 29 reaction will hinge primarily on whether management can sustain or raise the gross margin trajectory and provide visibility into cloud customer commitments. A modest EPS beat paired with cautious guidance would likely produce a negative reaction, while meeting estimates with a tightened or raised outlook could drive upside.
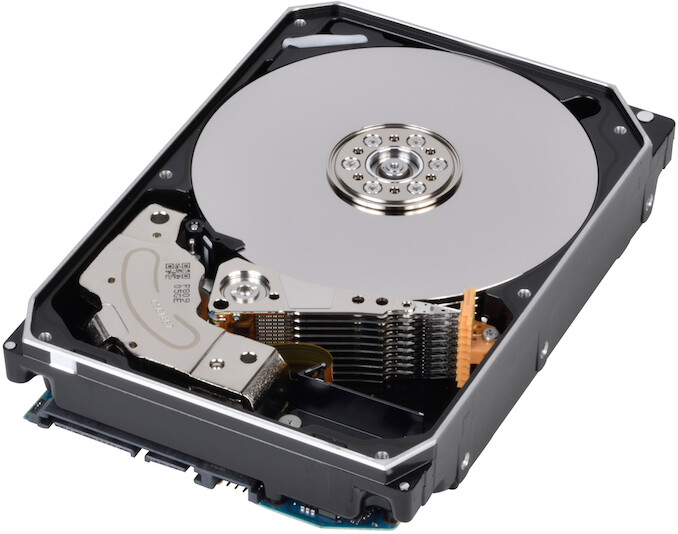
Internal components of a modern hard drive showing the precision engineering that enables high-capacity data storage
Expected Move & Implied Volatility
62%
78%
54%
The options market is pricing an 8.2% move in either direction following the earnings report, implying a range of $255.52 to $301.16. This expected move sits above the +3.3% average historical reaction, suggesting heightened uncertainty driven by the stock’s 49.4% gain over the past month and its position 17.6% above consensus price targets. Implied volatility of 62% ranks in the 78th percentile of the past year, indicating options traders are pricing above-average event risk.
The elevated IV relative to 30-day historical volatility (54%) reflects concern that the stock’s momentum may have created asymmetric downside risk. If results merely meet the guided midpoint without raising the forward trajectory, the stock could give back a meaningful portion of recent gains as investors reassess whether the AI premium is justified. Conversely, a beat paired with raised gross margin guidance could drive the stock toward the upper end of the implied range, validating the re-rating and potentially forcing analyst target increases.

Cloud computing infrastructure driving demand for Western Digital’s enterprise storage solutions
Expert Predictions & What to Watch
Key Outlook: Cautiously Bullish with Elevated Execution Risk
The bull case rests on Western Digital’s ability to demonstrate that the margin expansion of the past year is structural rather than cyclical. Seagate’s strong December quarter, which showed 22% revenue growth and record margins, has validated the sector thesis that AI-driven data center buildouts are creating sustained demand for nearline HDDs. If Western Digital can match or exceed Seagate’s performance while providing specific commentary on customer purchase order visibility and capacity commitments, the stock could sustain its premium valuation and force upward revisions to the $229 consensus price target.
The bear case centers on valuation and execution risk. At 39.4x trailing earnings and 25.7x forward earnings, Western Digital trades at a significant premium to both its historical range and its primary competitor. The stock has risen 49.4% in the past month alone, creating a setup where any disappointment on guidance could trigger profit-taking. Historical patterns show that Western Digital has missed revenue estimates five times over the past two years, and the current consensus of $2.94B sits only modestly above the $2.90B guided midpoint, leaving limited room for error.
Key Metrics to Watch

The January 29 report will be evaluated primarily on whether management can sustain the narrative that drove the stock’s 457% gain over the past year. Investors will parse commentary for evidence that cloud customer demand is durable, that pricing discipline can be maintained in the nearline HDD market, and that the 44-45% gross margin range represents a floor rather than a ceiling. The ability to provide specific metrics on customer commitments, capacity utilization, and forward visibility will determine whether the stock can hold its premium valuation or faces a correction toward analyst targets.
Searching for the Perfect Broker?
Supplement your charting with a free trading platform that rivals the best out there – multiple charts on one screen for easy monitoring, ProRealTime provides the perfect support for your investing or trading journey.
Discover our top-recommended brokers for trading stocks, forex, cryptos, and beyond. Dive in and test their capabilities with complimentary demo accounts today!
- IG Top-tier regulation – Read our Review
- eToro Wide range of instruments available to trade – Read our Review
YOUR CAPITAL IS AT RISK. 76% OF RETAIL CFD ACCOUNTS LOSE MONEY