
The earnings reports, which shed light on how businesses are performing, often determine the direction the stocks themselves take for coming months but also provide a steer on the broader market as well. With household names such as Johnson & Johnson, Microsoft, and Citigroup sharing updates on what is and isn’t working for them, earnings season is a chance to get a tangible grasp of what stocks to invest in next. The Q2 earnings season of 2022 looks to be no exception.
Big banks are typically first out of the blocks and Citigroup’s beat has resulted in the firm’s stock rising by as much as 25% in just over a week. Johnson & Johnson’s earnings beat was followed by an intraday 7% price rally and the good news Apple shared in its report resulted in Nasdaq 100 index futures surging by more than 1.5% in the space of one hour.
The stock market sell-off of early 2022 might not be done and dusted quite yet, but some market gurus think now is the time to buy and that means these stocks could be leading the way to the next bull run. The good news for investors is that there is still time to catch the ride to the upside.
What Is An Earnings Estimate?
An earnings estimate is the forecast made by industry experts relating to what a firm's earnings per share (EPS), and total earnings might be for the previous quarter’s trading. The analysts might be part of teams at investment banks, institutional investment funds or specialist third-party research firms. Their individual predictions are made using their own market research and ‘guidance’ offered by the reporting firms. The latter element is provided by firms so that they can try and avoid investors being surprised and the share price in question whipsawing too dramatically.
The process of collecting a range of forecasts and averaging it out into a single number involves some ‘smoke and mirrors’ but is established market practice. Most crucially, it allows key metrics such as EPS to be used as a measure of a firm’s situation. Once the company makes its official announcement, the two reality and forecast are compared, and the share price allowed to react accordingly.
Q2 Earnings Report Beats – Citigroup
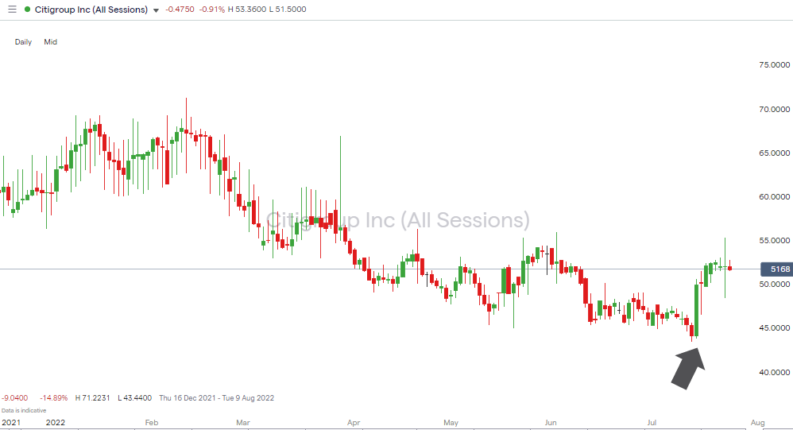
The role which big banks play as a bellwether of the wider economy means that Citigroup’s Q2 earnings beat, and resultant price spike are welcome relief for stock investors. The night before it reported, Citi stock closed at $44.1 but after announcing its figures on Friday 15th July Citi stock surged 13% on an intraday basis. Those feeling any sense of FOMO still have time to climb aboard Citi’s revival with the stock continuing to rally and printing a new monthly high of $52.48 on Wednesday 20th July.
Citi Beats on Top and Bottom Numbers
The turnaround at Citigroup caught some investors by surprise. The firm went into the Q2 earnings season widely regarded as the underperformer in the banking sector. But with four big banks having now reported, Citi is the only one to have beaten earnings estimates.
It hasn’t been an easy 2022 for the firm, which has the greatest exposure to the current geopolitical situation of all the Wall Street banks. However, the management team’s long-term strategy update, which was announced in March, is already paying off. Earnings per share were $2.19 vs $1.68 expected and headline revenue was an impressive $19.64bn compared to a forecast of $18.22bn. Unsurprisingly, the stock took off and recorded its biggest post-earnings stock price gain for more than 20 years.
The net interest income numbers offer significant hope for all banks that the move by the Fed towards higher interest rates will result in larger margins on the core borrowing and lending spreads. That number jumped 14% to $11.96bn and topped the $11.21bn estimate made by analysts.
Citigroup Inc – Daily Price Chart – 2022 – Earnings Beat on 15th July
Source: IG
Despite the sudden surge in the stock price, Citigroup remains the cheapest of the big Wall Street banks in the market. Those buying now will still benefit from a dividend yield of 3.36% and a remarkably low P/E ratio of 5.78 and with the year-to-date high being $71.22 there is still plenty of room for the stock to rally before addressing that particular technical indicator.
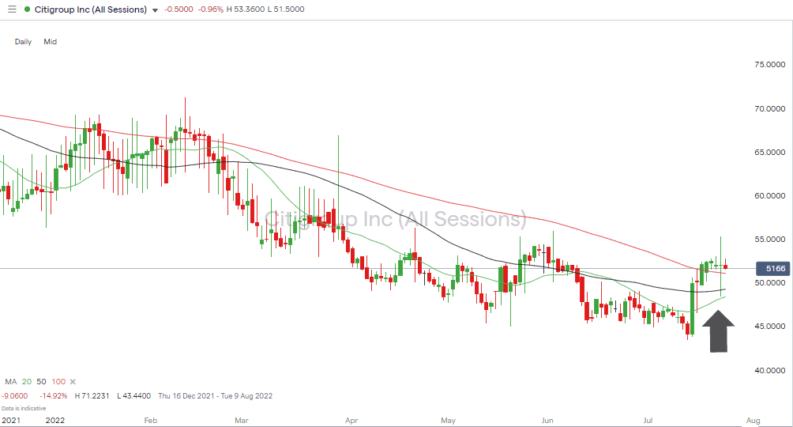
Citigroup – Daily Price Chart – 2022 – Trading Above Daily SMAs
Source: IG
From a technical analysis perspective, the most significant shift has been price lunging from trading below to above all of the key SMAs on the Daily Price Chart. Citi stock has, since February 2022, on only one occasion, traded above the 100 Daily SMA. This now means that the one time price resistance point has, in the space of one week, turned into a significant price support level. Buying into weakness, which takes the stock into the region of $51.08 means traders will also benefit from the support offered by the psychologically important $50 price level.
Q2 Earnings Report Beat – Johnson & Johnson (JNJ)
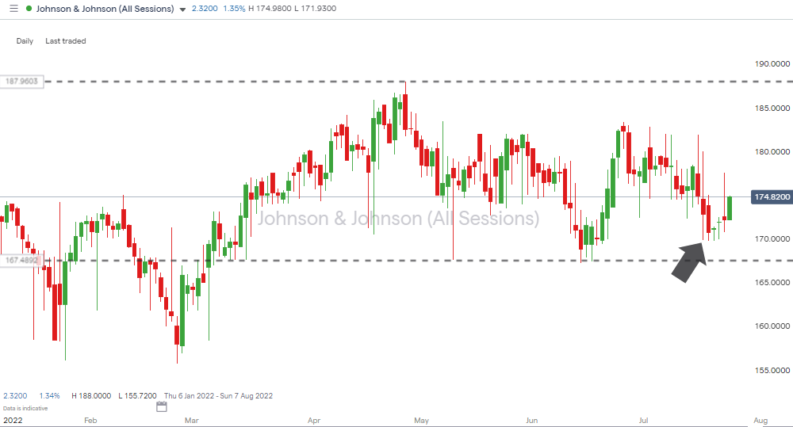
Johnson & Johnson’s earnings beat is a different beast to that of Citigroup’s. It fits in with the statistics that point to more than three-quarters of firms in the S&P 500 beating expectations. Investors in one of the market’s most dependable stocks won’t mind too much, a win is still a win and the JNJ stock price immediately rallied by 7% after new buyers stepped in on the back of the good news.
Earnings Beat But Guidance Downgraded
The Q2 earnings data released on 19th July 2022 showed that the EPS for JNJ came in at $2.59, which beat the Zacks Consensus Estimate of $2.57. This represented an increase of 4.4% on a year-on-year basis.
Digging into the details, it’s obvious that JNJ is only just clearing the bar set by analyst expectations. Sales came in at $24.02bn, which was just over the Zacks Consensus Estimate of $23.91bn. Possibly more concerning is that the extent to which the firm beats expectations is getting smaller each earnings season. Net profit margins in Q2 were 20.04%, which represents a year-on-year fall of 24% and a continuing slide from the 21.98% number recorded in April 2022.
Johnson & Johnson – Daily Price Chart – 2022 – Price Consolidation
Source: IG
The sideways trading pattern on the 2022 Daily Price Chart might not be one to excite investors, but that misses the real benefit of buying JNJ shares. The fact the firm has held its value in 2022 while other big names such as Apple have tumbled by more than 10%. This highlights how Johnson & Johnson’s role as a defensive stock makes it a welcome member of any well-diversified portfolio.
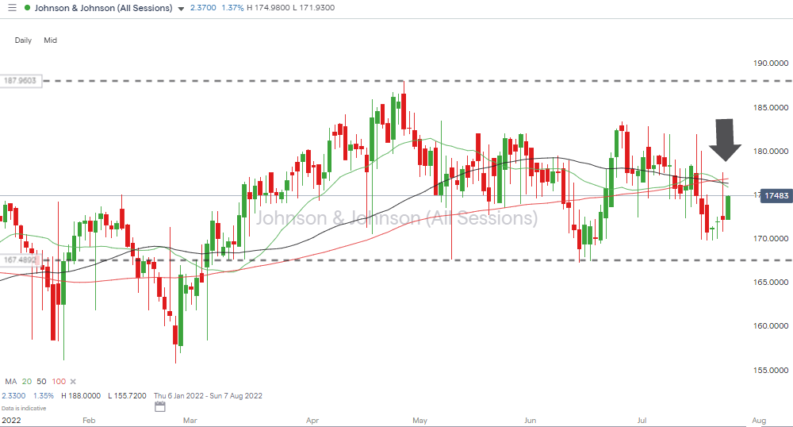
Johnson & Johnson – Daily Price Chart – 2022 – Converging SMAs
Source: IG
The next tests for JNJ stock are the 20, 50 and 100 Day SMAs ,which have converged to be in a tight range of $175.84 and $176.83. A move through those price levels would be a sign that the good news in the recent earnings report has done enough to restore investor confidence and waiting for confirmation from a technical analysis perspective could be a good move. With the shares currently trading at $174.83, a little patience could help investors avoid the risk of buying into the shares too early.
There also exists the chance of a harder pullback to the $167 support level due to the guidance for Q3 being downgraded by the firm. In the accompanying statement, the adjusted EPS forecast was lowered from a range of $10.15 – $10.35 per share to $10.00 – $10.10. While this represents a solid enough increase of 2.1% – 3.1%, that is lower than 3.6% – 5.6% targets previously announced.
The firm’s management attributed the downgrade to currency moves. As a multinational, it generates a lot of revenue in non-US markets and given the strength of the dollar, those profits when converted back into USD mean the bottom line from a dollar perspective is impacted. On the other hand, should the US Federal Reserve take a more dovish stance on US interest rates, then that could be a trigger for entering into a long JNJ position.
Q2 Earnings Report Beats – Apple Inc (AAPL)
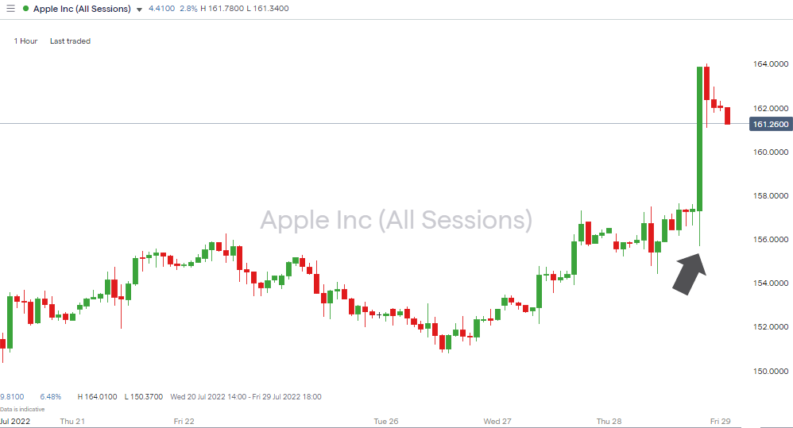
The earnings beat posted by Apple Inc on 28th July 2022 demonstrated the extent that earnings season can go on to dictate the mood of the markets. On the same day that economic data confirmed the US had technically gone into a recession, the positive numbers by posted resulted in global stock markets surging in value.
Apple’s position as a flagship for the stock markets makes it one of the big names to look out for. The fact that 41% of its stock is held by retail investors means for many investors that the Apple announcement is the one that sets the mood for the next financial quarter. With a market cap of $2.6tn, price changes in AAPL stock can literally move the market.
Apple’s Earnings Beat Lifts The Market
Soon after making its Q2 earnings announcement, Apple stock was up more than 3% in after-hours trading. Investors lapped up the good news on EPS and revenue – both of which came in above analyst expectations.
The beat wasn’t as convincing as it could have been, but for investors who had suffered a tough first year of trading, a win was a win. Actual EPS registered at $1.20, above the consensus prediction of $1.16 and top-level revenue of $83.0bn topped the $82.8bn estimate.
Apple Inc – Hourly Price Chart – 28th July 2022
Source: IG
The one surprising move was that Apple was not in a position to provide formal guidance for Q3. Analysts had hoped an EPS in the region of $1.31 would be mentioned, but the management team steered clear of offering any hard numbers at this stage.
Apple CEO Tim Cook said, “In terms of an outlook in the aggregate, we expect revenue to accelerate in the September quarter despite seeing some pockets of softness” (source: CNBC).
Big corporations may not be back to their buoyant best right now, but picking through the text of the supporting commentary now looks as good a time as any to buy back into the Apple success story.
Why Do So Many Firms Post Earnings Beats?
During earnings season, it’s easily possible to fall under the impression that lots of stocks are posting ‘beats’. The reason the news wires keep on using the term is that over a five-year period, the number of firms in the S&P 500 stock index that beat EPS forecasts is on average 77%.
The natural bias could be down to analysts wanting to protect their professional reputation by erring to the downside and not appearing to get carried away. There is also the influence of firms that offer ‘guidance’ in the build up to the announcement, and benefit from beating a target, even if it was set unrealistically low.
Historical data on the size of any beat offers a greater insight into how a stock price might react. A big beat obviously increases the chance of a greater share price spike. In Q1 of 2022, companies reported earnings that were 4.9% above estimates, which is below the five-year average of 8.9%.
When trying to calculate how a stock might react to its earnings announcement, it’s also worth looking at its existing shareholders. Some stocks are prone to big moves after reporting earnings and can easily gap up. Others, with ‘sticky’ investors react to a lesser extent. The share price reaction to Johnson & Johnson’s earnings report was relatively muted partly because of the downgraded guidance, but also because of the profile of its shareholders. It ranks as one of the stocks with the ‘stickiest’ investors. Passive funds own 24% of its shares 30% is owned by retail investors, who sometimes turn a ‘buy-and-hold’ approach into one which is more ‘buy-and-forget’.
Stocks owned by shareholders with a longer-term view and are less likely to be influenced by one-quarter of surprisingly good or bad earnings. This in turn results in more speculative market participants, such as day-traders targeting other names. This means that the beat posted by JNJ may take time to be reflected in the share price.
Historical data relating to the S&P 500 index shows that the stickiest stocks, such as Johnson & Johnson, which beat earnings tend to rise by only 0.5% whereas the average for the index is 0.7%. The reaction is also muted when earnings miss, with the average price fall for the index being 2.3% but sticky stocks only falling by 1.4%.
If you’re wondering which other stocks are sticky and might have a delayed price reaction then Apple Inc tops the list (passive 20%, retail 41%), followed by Amazon (passive 17%, retail 40%), Ford (passive 22%, retail 47%), and Exxon Mobil (passive 24%, retail 43%).
Final Thoughts
Whether you are an experienced investor or a complete beginner, it’s important to appreciate how earnings season can be a time when opinions on stocks are recalibrated and new trends emerge. An earnings beat can result in significant buying pressure coming into the market, but it’s worth also considering the size of the stock, guidance updates, and if the stock has ‘sticky’ investors. These trusted brokers offer the economic calendars, previews, and reviews of earnings reports, which you’ll need to diarise upcoming announcements and be ready to react accordingly.
