The Q3 2022 earnings season has kicked into gear and is already offering clues as to which of the biggest earnings season winners are worth buying. With the reports providing a detailed insight into the performance of corporate giants, there is a clear opportunity to pick out the firms with the best prospects.
YOUR CAPITAL IS AT RISK

The first three quarters of 2022 have been a torrid time for shareholders. While the release of corporate results is always a significant milestone, that is even more so the case now. Stock investors are desperately looking for a catalyst to trigger a stock market bounce after macroeconomic concerns about interest rates and inflation have dragged share prices down. The firms selected for this article are those that are posting earning ‘beats’ and are most likely to be able to hit the ‘reset’ button making them the Biggest Winners From Early Quarter 3 2022 Earnings Reports in our expert opinion.
Table of contents

What Is An Earnings Estimate?
An earnings estimate is the forecast made by financial analysts. It predicts what a firm's earnings per share (EPS), and total earnings, might be for the previous quarter’s trading. The analysts’ individual predictions are collated and aggregated in the build-up to the official release by a company and provide an easy-to-use numerical measure of market expectations.
The analysts are industry experts working at investment banks, institutional investment funds, or specialist research firms. They carry out their own technical and fundamental analysis and incorporate ‘guidance’ offered by the reporting firms. The latter element is provided so that the firms in question can manage expectations and, if necessary, pre-warn investors of bad news.
Once the company makes its official announcement, the estimated and actual numbers can be compared and large differences between the two figures can be expected to be matched by a move in the company’s share price.
Historical records point to a natural bias towards there being more earnings season ‘beats’ than ‘misses’. While more than three-quarters of firms clear the bar, it’s also important to establish by how great a distance.
Comparisons with firms that are in a company’s peer group are also useful. They can help establish how deep-rooted any success story is and if it is stock- or sector-specific. One other factor to consider is the profile of the typical investors in a specific stock. Different types of shareholders react to earnings reports in different ways. Some investors take immediate action, while others might adopt a more measured approach.
Q3 Earnings Report Beats – Netflix (NFLX)
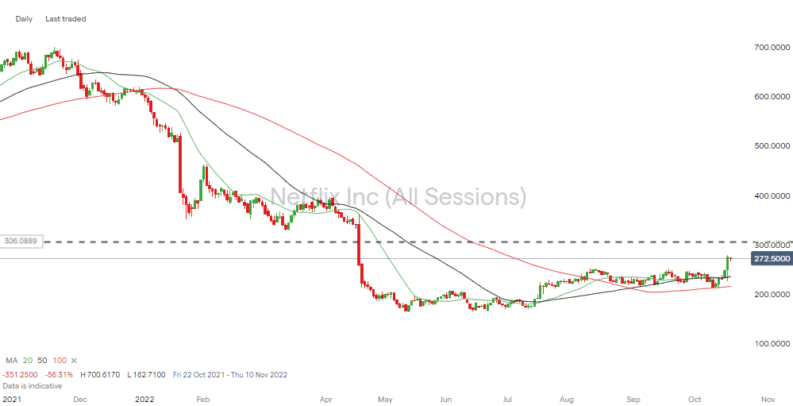
Streaming giant Netflix posted an earnings beat on Tuesday, 18th October, which prompted a +14% intraday surge in the stock. There’s still plenty of room for bottom-fishers looking to pick up an undervalued stock, which had fallen out of favour with investors. Despite the rally, the NFLX share price is still down 54.3% on a year-to-date basis.
The Netflix growth story of the last decade was based on the firm being able to develop a global subscriber base. As analysts were counting the additional ‘eyeballs’ signing up to the service, the share price rocketed from $98 in October 2016 to $690 in October 2020.
A significant shareholder exodus was seen in 2022 based on concerns that the market was becoming saturated. But this quarter’s earnings report has flipped the situation around. It demonstrated that while Netflix might not be able to increase its total number of subscribers, it is coming up with ways of squeezing additional revenue out of what is proving to be a relatively loyal customer base.
Netflix Beats on Top and Bottom Numbers
The scale of the Netflix EPS beat goes some way to explaining the resulting surge in the share price. Analysts had forecast EPS of $2.13, but that estimate was beaten by the actual figure, which came in at $3.10. Total revenue was another beat – the company reported $7.93bn versus the £7.83bn forecast.
The bottom line looks set for further improvement. Key guidance detailed in the report outlines the company’s plans to crack down on password sharing. The approach is already being trialled and involves a ‘carrot and stick’ approach, with price-sensitive users being offered the option of a cheaper plan that features revenue-generating commercials.
To round off a stellar set of results, Netflix also posted a beat in terms of new subscribers. Even though it is focussing on other ways of growing revenue, there were 2.41 million more net subscribers to the platform in Q3. This represents growth in user numbers being more than double what it was one year ago.

Netflix is still some way off from wanting to pay dividends to shareholders. All the cash is being pumped back into the company’s growth plans. As such, those buying Netflix now will be looking for capital growth. That makes the P/E ratio a key metric. With that number currently being in the region of 24.4, Netflix looks undervalued compared to its main streaming rival Disney (DIS), which has a P/E ratio of 57.5 at the time of writing.
| Growth, Valuation, Trading | Information |
| Market cap | USD 102.28B |
| EPS recent fiscal year | USD 10.68 |
| Profit margin | 15.598% |
| Return on investment | 14.389% |
| Normalised P/E ratio | 21.544 |
One topic that was discussed to a far less extent than in previous earnings reports was COVID. The pandemic and lockdowns triggered a boom in subscribers but also impeded the pipeline of ground-breaking high-quality shows, which have become the streamer’s hallmark. That bump in the road appears to be passed, and the Q3 guidance is that of a firm fully focused on future growth.
Q3 Earnings Report Beats – JP Morgan Chase & Co (JPM)
Wall Street giant JP Morgan (JPM) has always been one of the first choice stock picks for anyone looking to buy into the finance sector. The bank’s earnings beat on Friday 14th October could be the trigger needed to tempt those who have been standing on the sidelines waiting to buy JPM stock.
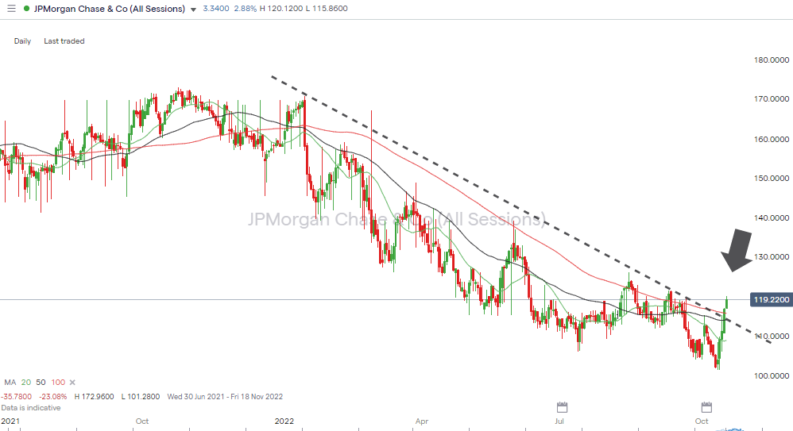
The JP Morgan earnings beat resulted in the stock price immediately gaining by 1% and going on to build further momentum. Thursday’s pre-announcement closing price of $109.07 proved a solid launch pad for the stock, which just three trading sessions later clipped $120.00.
There does still appear to be opportunities to buy into JPM stock thanks to the healthy outlook for the banking sector as a whole. The rise in interest rates might be bad news for some firms, but banks have historically performed best when rates are higher. When rates are higher, banks are able to expand the margins on the bid and offer spread that they offer to savers and borrowers.
JP Morgan Beats on Top and Bottom Numbers
The Q3 earnings numbers certainly show promise for JP Morgan shareholders. The actual EPS of $3.12 topped the analyst consensus figure of $2.86 and total revenue of $32.72bn also came in above the estimated $31.88bn.
Digging into the granular detail reveals more reasons to buy JP Morgan stock. Return on tangible common equity was 18% and net interest income was $17.6bn.
One area of concern was the provision for credit losses of $1.54bn, which came in above the forecast $1.37bn. This reflects that while higher interest rates help the bank’s operating margins, it also increases the risk of defaults. The potential for an increase in the number of bad debts is a point highlighted in the accompanying statement presented by CEO Jamie Dimon.

Despite the sudden surge in the stock price, JP Morgan is still calculated to be paying investors a dividend yield of 3.42% and has a modest P/E ratio of 9.88. The market capitalisation of $343bn also reaffirms that the bank has the critical mass required to navigate a path through the heightened levels of geopolitical and recessionary risk associated with 2022.
| Growth, Valuation, Trading | Information |
| Market cap | USD 326.57B |
| EPS recent fiscal year | USD 15.36 |
| Dividend yield | 3.597% |
| Profit margin | 30.037% |
| Return on investment | – |
| Normalised P/E ratio | 7.183 |
Source: IG
From a technical analysis perspective, there will be some optimism among investors that JPM managed to break above the downwards trendline, which dates back to January 2022. The post-announcement surge also took the stock price above the 50 and 100 SMAs on the Daily Price Chart.
JP Morgan’s Q3 earnings beat was good news for the bank’s shareholders and for the broader markets. Banks are seen as bellwethers of the economy, so the positive earnings report for JPM offers hope to those judging that the market has finally bottomed out.
Q3 Earnings Report Beat – Lockheed Martin (LMT)
The headline figures relating to Lockheed Martin’s earnings beat were not as impressive as those of JP Morgan, but the guidance offered in the company’s statement makes it a top stock pick for those willing to read between the lines.
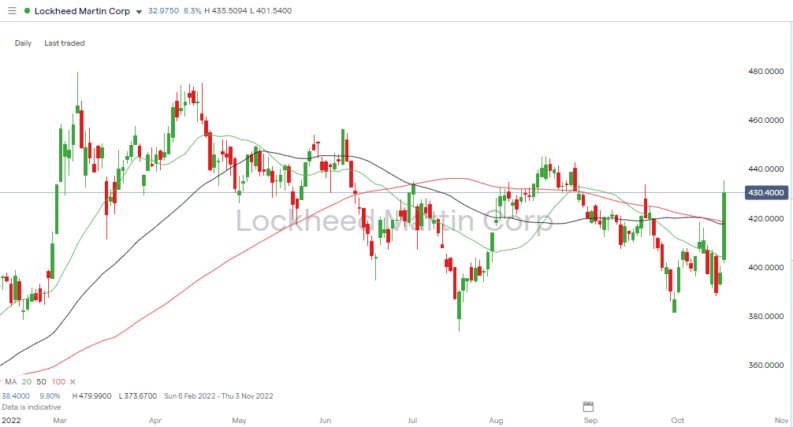
Soon after the report was released on Tuesday 18th October, LMT stock rallied to trade more than 6% higher than its previous closing price. The surge in demand took price through the psychologically important $400 price level and up to $435 within the space of a few hours.
The solid performance, particularly in EPS, points to future growth for the aerospace, arms and defence manufacturer, and the earnings report suggests a lot of the good news is not yet priced in.
EPS Beats Forecast But Revenue Growth Delayed
Actual EPS came in at $6.87, which beat the analyst forecast of $6.68. Revenue of $16.58bn was up $555m from the previous year but missed the analyst forecast. The reason cited by the firm was that, while the order book was healthy, the deals were taking longer than expected to move through the pipeline.
Lockheed Martin’s management also highlighted supply-side issues as being a reason revenue growth wasn’t meeting expectations. The legacy of COVID and a tight labour market was blamed for production levels remaining ‘choppy’.
The updated guidance is that top-line growth will now materialise in 2024 rather than 2023. Asked how the conflict in Ukraine might impact demand, CFO Jay Malave stated that the firm’s order book was positioned to replenish equipment in closer to two years’ time rather than banking new orders now.

Lockheed Martin investors currently benefit from a 2.82% annual dividend yield, but capital growth is also on the cards. The Q3 statement included a crucial update that the LMT stock buyback program is going to be expanded by $14bn. With profit margins currently in the region of 7%, shareholders can hope that the mentioned supply-side issues are smoothed out, resulting in a greater proportion of revenue being returned to investors.
| Growth, Valuation, Trading | Information |
| Market cap | USD 103.25B |
| EPS recent fiscal year | USD 22.76 |
| Dividend yield | 3.082% |
| Profit margin | 7.332% |
| Return on investment | 17.153% |
| Normalised P/E ratio | 13.908 |
Source: IG
Lockheed Martin hasn’t suffered the same share price crash as some other stocks – an uptick in geopolitical risk is typically associated with increased revenues for arms manufacturers. But the Q3 2022 earnings season could be the moment when the new contracts that Lockheed Martin has signed start to be priced in.
Why Do So Many Firms Post Earnings Beats?
Over a five-year period, the number of firms in the S&P 500 stock index that beat EPS forecasts is, on average, 77%. A succession of beats can boost market sentiment and trigger bull runs, but all that good news can make it difficult to filter out the best stocks to buy.
Turning attention to the size of the beat is the obvious next step but relative as well as absolute performance need to be considered. Historical data shows that in Q1 of 2022 companies reported earnings that were 4.9% above estimates. This is under the five-year average of 8.9%. As such, a firm that posted Q1 2022, earnings that beat estimates by 6% might disappoint investors who have tracked returns for several years but would have outperformed its peer group in terms of 2022 metrics.
It is also worth considering the natural bias towards firms posting ‘beats’. That could be down to analysts wanting to protect their professional reputation by erring to the downside and not appearing to get irrationally overenthusiastic. It is also in the interests of the firms to offer ‘guidance’ that allows them to jump the bar, even if it is set at an unrealistically low level. Whatever the reason, the outcome is that a series of beats can lead to a market-wide rally.
What Determines Stock Price Reaction To Earnings Beats?
Another factor to consider is the profile of a company’s typical shareholder, as this can influence the extent to which an earnings beat results in a share price rise. Stocks such as Netflix (NFLX) and Snap (SNAP), which are targeted by day traders and other short-term speculators, can be expected to have a more dramatic price reaction after earnings are released.
At the other end of the spectrum are stocks such as Johnson & Johnson (JNJ) and Apple (AAPL), which tend to be owned by investors with a buy-and-hold approach. A stellar or disappointing earnings report can be seen by long-term investors as a bump in the road rather than a reason to trade.
Stocks that have a greater proportion of ‘sticky’ investors tend to have a more muted reaction to earnings news. In the case of Johnson & Johnson, passive funds own 24% of the company’s shares and 30% is owned by retail investors.
Historical data relating to the S&P 500 index shows that the stickiest stocks, such as Johnson & Johnson, tend to rise by only 0.5% when they beat earnings, whereas the average for the index is 0.7%. The good news for long-term investors is that the reaction is also muted if the company posts an earnings miss. The average price fall for the index is 2.3% but sticky stocks only fall by 1.4%.
If you’re wondering which other stocks are sticky and might have a delayed price reaction, then Apple Inc tops the list (passive 20%, retail 41%), followed by Amazon (passive 17%, retail 40%), AT&T (passive 21%, retail 46%), and Pfizer (passive 23%, retail 31%).
Final Thoughts
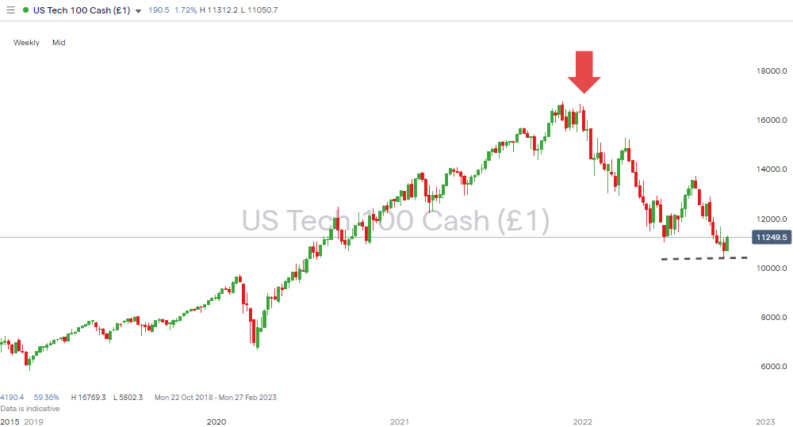
Going into the 2022 Q3 earnings season, the NASDAQ 100 index was down by 36% on a year-to-date basis. That could be a tempting situation for traders looking to pick the bottom of the yearlong sell-off. Taking advantage of the up-to-date information released by big companies allows investors to establish not only if a firm ‘beats’, but also the reasons for that outperformance.
There are added layers of complexity in the Q3 2022 earnings season. Inflation, interest rates, and rising energy costs are all squeezing the average consumer. Forecasting how long those will remain key price drivers is notoriously difficult to do.
Analysts are also still adjusting to the aftershocks of the COVID pandemic. The move to more working from home is just one factor that firms need to contend with in terms of their own productivity and cost base, but also in terms of the changing habits of their consumers.
Whether you are a novice investor or an experienced trader, earnings season is a time of excitement and new opportunities. Opinions on stocks are updated and new trends emerge. AskTraders’ trusted brokers offer the economic calendars, previews, and reviews of earnings reports to help you prepare to pick up the stocks posting the biggest earnings beats.
People Who Read This Also Viewed:


