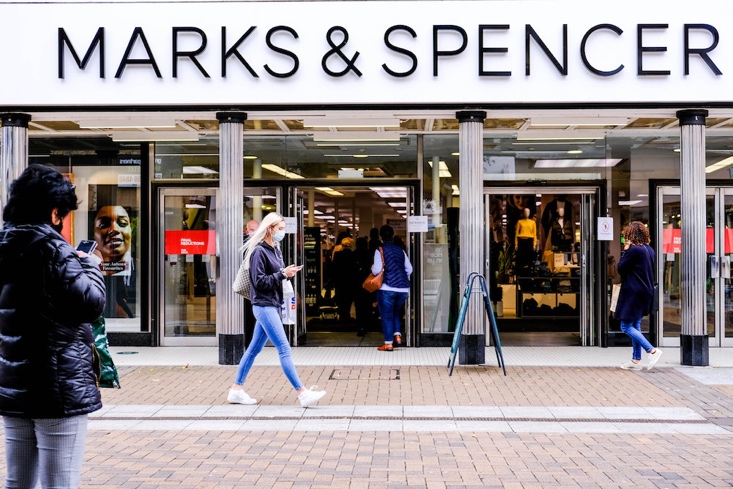
Marks & Spencer shares are listed on the London Stock Exchange under the ticker symbol MKS. The stock is also included in the FTSE 100.
Marks and Spencer Group, commonly known as M&S, is a renowned British retailer founded in 1884 and headquartered in London. It holds a significant position in the UK retail sector, particularly known for its high-quality clothing and food offerings.
M&S operates across various areas, including Clothing & Home, offering a range of apparel and homeware products and Food. It also owns a 50% share in the UK grocery retail business Ocado.com, with the other 50% owned by Ocado Group.
The current Marks & Spencer CEO is Stuart Machin. He took up the role in May 2022, having joined M&S as Food Managing Director in April 2018.
M&S Share Price & Dividend Yield
Marks & Spencer Dividend Yield: 0.99%
The company’s share price has moved significantly over the past 12 months, climbing more than 68%. Its performance is largely thanks to its turnaround plan, which has boosted its sales and profitability.
Marks & Spencer Share Price Forecast
Overall, the analyst view on Marks & Spencer is overwhelmingly bullish, with 13 assigning the stock a Buy rating and three assigning it a Hold rating.
A View From The Bulls: Marks & Spencer upgraded to Buy from Hold at Jefferies 04/21 MAKSY Jefferies upgraded Marks & Spencer to Buy from Hold with an unchanged price target of 310 GBp. The firm’s UK consumer cash flow model shows a consumer with “substantial disposable income recovery” over the next year, with fiscal 2024 and 2025 growth of 7% as rising wages and sinking energy costs offset incremental pressures from housing. The analyst sees an upbeat consumer environment fully translating into a supportive clothing retail market.
A View From The Bears: With M&S shares trading at their highest levels since 2018 (at the time of writing), finding bearish commentary on the stock is understandably difficult. However, given the shares continue to climb, potential investors should consider where they feel is a fair valuation for the company.
Average Analyst Consensus 12-Month Price Target: 332.3p
Our View: We, like many others, have been impressed with the M&S turnaround. That is now paying off for the company and shareholders. While the stock is currently on a strong run, we do see a continued positive trajectory over the near to medium term.
Who Should Buy Marks & Spencer Shares
The Marks & Spencer share price currently represents a potentially attractive opportunity, but that does not mean everyone will want to own it. Here’s who may prefer Marks & Spencer shares:
Marks & Spencer operates in a competitive retail environment, facing challenges from discount retailers and online shopping. Additionally, economic fluctuations can impact consumer spending. Therefore, M&S shares might be suitable for investors comfortable with some potential volatility and a moderate risk tolerance.
Marks & Spencer has a history of paying dividends to shareholders. While not the highest dividend yielder, it can provide a source of income for those seeking regular payouts.
Despite the recent movement in the MKS share price, some investors still might view Marks & Spencer as potentially undervalued relative to its historical performance.This could present an opportunity for capital appreciation in the long run. However, you will still need to conduct thorough research and analysis to determine the company’s true value and assess if it aligns with the current share price.
Given Marks & Spencer is seen as more of a premium supermarket, investors that forecast a pick-up in consumer spending may see the stock as a good choice going into the second half of the year and into 2025.