Shell shares (LON: SHEL) are a component of the FTSE 100, and the firm is a renowned global energy company with a rich history dating back over a century. The multi listed company has established itself as a leader in the oil and gas industry.
The company has grown exponentially since its journey began in 1907 when the Royal Dutch Petroleum Company and the Shell Transport and Trading Company merged to form the Royal Dutch Shell Group.
Shell operates in various segments, including upstream, downstream, and integrated gas. In the upstream segment, Shell focuses on the exploration and production of oil and gas resources. The company has a strong presence in both conventional and unconventional resources, allowing it to maintain a diverse portfolio of assets.
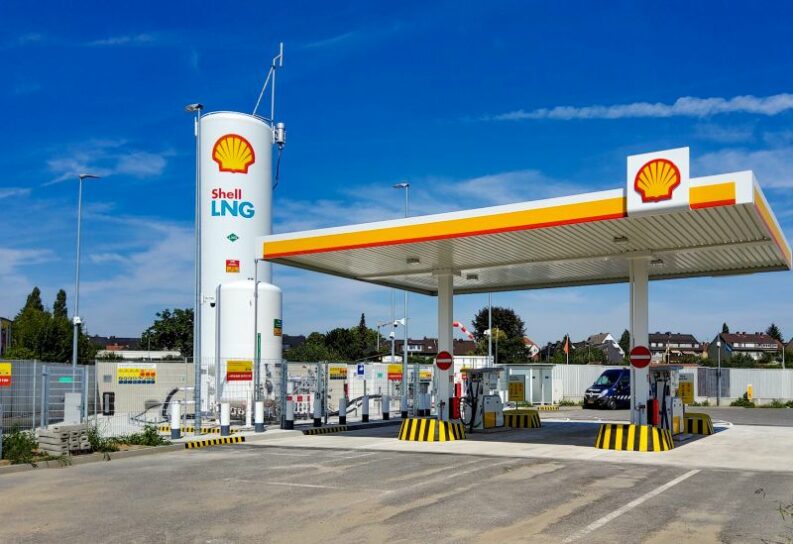
In the downstream segment, Shell’s network of fuel stations serves millions of customers every day. From retail fuels to lubricants and chemicals. Shell has also made moves in renewable energy with various projects in many different areas of the renewable energy market.
Shell EPS and Revenue Breakdown 2020-2023
Shell plc, a British-Dutch multinational oil and gas company, has a rich history dating back to its founding in 1907 through the merger of the Royal Dutch Petroleum Company and The “Shell” Transport and Trading Company. The merger resulted in a period of rapid expansion for the company as Shell opened operations in Europe and in many parts of Asia. It also began exploration and production in Russia, Romania, Venezuela, Mexico, and the US.
Shell is a constituent of the FTSE 100 Index, signifying its stature as one of the top companies listed on the London Stock Exchange.
Shell is, first and foremost, an oil and gas company, it has also expanded into various renewable energy markets. It now has projects in sectors, such as wind, hydrogen, solar and biofuels.
Shell Share Price
While the Shell share price dropped significantly at the beginning of the pandemic as the global economy came to an almost standstill, it has since recovered. In late 2023, its shares hit their highest level since 2018 as conflicts in Ukraine and the Middle East resulted in oil prices rising.
However, it is still some way below its 2018 highs, while it has a lot further to go if it wants to once again reach the levels seen in 2014 and 2008 (not long before a decline began).
Shell Price Forecast
Conflicts in Ukraine and the Middle East over the last couple of years saw oil prices rise. As a result, the share prices of companies in the industry, such as Shell, have also risen.
Despite the recent pullback in Shell shares, analysts see the stock continuing to climb, with the current analyst average price target at 3,173.52p per share, representing a potential 10% upside from current levels (July 2024). Ten out of 13 analysts have a Buy rating on the stock, while three have a Hold rating.
In a recent research note, analysts at Morgan Stanley maintained an Equal Weight rating on Shell shares, telling investors that after steady underperformance in recent months, the risk/reward outlook for European energy has improved.
Meanwhile, at the start of the year, Piper Sandler raised its Shell price target to $75 from $71, keeping an Overweight rating on the stock. The firm stated that the oil market looks increasingly range-bound, and stocks are trading at reasonable valuations at the forward curve. Even so, they entered 2024 still moderately constructive on the sector, although less outright bullish than in recent years.
Our View: To invest in Shell or not… Despite governments globally looking to push the pursuit of clean energy, it seems that oil and gas will remain key commodities for the time being. In addition, with Shell also moving into renewable energy projects, we believe the company will remain resilient and is one to consider for dividend-focused investors.
Shell Suitability
When deciding whether to invest in shares of Shell, it’s essential to identify if they suit your investing needs and characteristics. Several factors come into play when determining if this stock aligns with an investor’s goals and risk tolerance.
For example, an investor’s risk tolerance can play an important role in determining whether an investment is suitable. Shell can be suitable for investors with a moderate risk tolerance. The energy sector, including oil and gas companies like Shell, can be influenced by various factors such as geopolitical events, commodity prices, and regulatory changes. However, they also pay a steady dividend, providing some stability.
Investment goals are another key aspect to consider. Investors seeking long-term capital appreciation may find Shell attractive, especially considering its global presence and potential for growth in the energy sector.
As mentioned, Shell is a dividend-paying stock. The company has historically offered competitive dividend yields, making it potentially appealing to income-oriented investors.
Sustainability and ESG factors are also something to consider when assessing Shell as a potential investment opportunity. While Shell has commitments to reduce carbon emissions and invest in renewable energy and has wind farm projects, the oil and gas industry is obviously not favoured by environmental conscious investors.
FAQ
In January 2022, Shell’s A and B share classes were simplified into a single line of ordinary shares. As a result, you will no longer be able to find Shell A or Shell B share price graphs, as they are no longer separate.