Picking the best S&P 500 index funds in the US requires a minimal degree of initial research and allows investors to take a relatively hands-off approach to making a return. Buffett’s advice is to
“Consistently buy an S&P 500 low-cost index fund, keep buying it through thick and thin, and especially through thin… I think it’s the thing that makes the most sense practically all of the time”
(source: CNBC)
With seasoned pros showing such confidence in S&P 500 index funds, it’s not surprising that there are many different firms offering them to investors. We’ve reviewed those on offer to provide a convenient shortlist of the best S&P 500 index funds to invest in now.
Why are S&P 500 Index Funds so Popular?
A more detailed breakdown of what the S&P index is and how it works can be found here. However, the advantages of investing in it can be easily summarised.
Investing in an S&P 500 fund means that risk and exposure are spread across a wide range of firms. A percentage of those companies might out or underperform the rest of the market, but the return on capital will be averaged out by the fund incorporating so many different stocks.
Historical returns are also impressive and are one of the main draws of S&P 500 index funds. Over the 10-year period that started in 2012, there was only one down year – 2018. In 2019, the index posted an impressive 31.49% increase in value. The broad coverage of a range of sectors in the funds also results in price volatility being relatively low when compared to other indices, meaning there is less chance of investors being shaken out of positions by short-term market noise.
Those worried that S&P Index funds might be an opportunity they have missed out on will note the trailing P/E ratio as of September 2022 was an attractive 22.89. With passive income streams also being part of the equation, dividend investors will be attracted by the average annual dividend yield for the index being around 1.7%.
S&P 500 Index Annual Return and Price Volatility
| Year | Total Calendar Return (including dividends) |
Volatility ($) |
| 2012 | 16.00% | 2.05 |
| 2013 | 32.39% | 9.15 |
| 2014 | 13.69% | 7.7 |
| 2015 | 1.38% | 4.66 |
| 2016 | 11.96% | 10.06 |
| 2017 | 21.83% | 11.19 |
| 2018 | -4.38% | 9.46 |
| 2019 | 31.49% | 15.63 |
| 2020 | 18.40% | 31.88 |
| 2021 | 28.71% | 29.7 |
| 2022 | – | 26.17 |
Source: SPGlobal / Netcials
Investing in the S&P also suits those who want to get exposure to the stock market but might not have the time to research individual stocks. The beauty of the S&P 500 fund is that it captures the potential upside of 500 of the largest US-listed stocks in one go.
Which S&P 500 Index Fund is Worth Your Investment?
With the above in mind, which of the many S&P 500 tracker funds is worth consideration? Below is our list of the best US dollar class S&P 500 ETFs to buy in 2022.
The net return on the funds is similar due to them being passive tracker funds. However, each one has reason to be considered a good option for someone looking to follow the advice of Warren Buffett.
The way the ETF (Exchange Traded Funds) are managed is another reason investing in the S&P index is an attractive proposition. As their investment mandate is to track the performance of the index, and not out-perform it, there are minimal additional expenses related to hiring fund managers tasked with chasing alpha.
Investment firm Vanguard, which offers a range of fund products, points to research carried out on the ETF sector, which calculates the average expense ratio for ETF funds, in general, being 0.24%. A 0.24% expense ratio means that $24 of every $10,000 invested is annually collected as a management fee.
That charge reflects the work the fund manager carries out going into the market and buying 500 stocks on behalf of clients. For most investors, this is a small price to pay for the convenience of executing just one trade instead of 500.
SPDR S&P 500 ETF Trust (SPY)
The SPDR S&P 500 ETF Trust is the largest ETF in the world and, as of September 2022, had a market capitalisation of $308bn. The fund is run by well-regarded State Street Global Advisors and listed on the NYSE Arca exchange under the ticker SPY.
It is also the oldest ETF in the world, having been first listed in 1993, and thanks to all these credentials, the daily trade volumes in the fund also top the global charts. Trading in liquid instruments avoids the risk of getting stuck in a position and keeps bid-offer spreads tight. There’s plenty of flow in the SPY ETF and as of December 2021, the 30-Day average daily volume range for the previous five years was 82.4m shares.
SPDR S&P 500 ETF Trust Annual Returns
| Year | Annual Returns With Dividends |
| 2012 | 15.99% |
| 2013 | 32.32% |
| 2014 | 13.46% |
| 2015 | 1.23% |
| 2016 | 12.00% |
| 2017 | 21.71% |
| 2018 | -4.57% |
| 2019 | 31.22% |
| 2020 | 18.33% |
| 2021 | 28.73% |
| 2022 | – |
The expense ratio of the fund is 0.0945%, which is low compared to the average for the wider ETF sector, but slightly higher than some of the S&P index tracker ETF peer group. This could reflect the managers leveraging off their position as a market-leading brand, but despite the marginally higher costs, the annual performance table for SPY shows returns in line with those of the S&P 500 index itself.
SPDR S&P 500 ETF Trust – Weekly Price Chart – 2010 – 2022
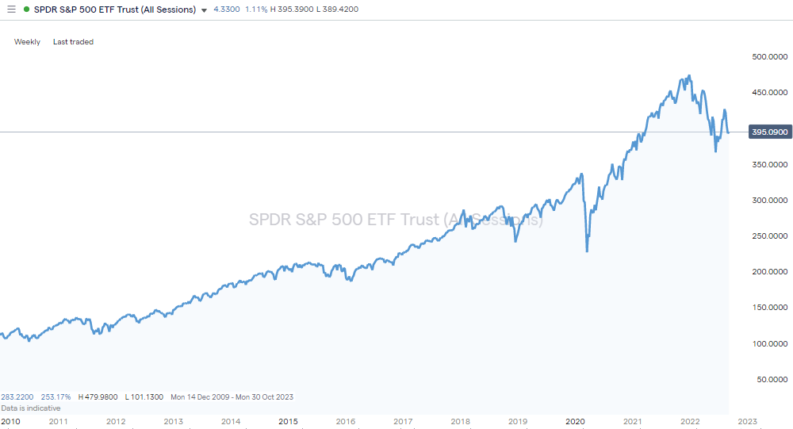
Source: IG
Thanks to its extended historical track record and size, the SPDR S&P 500 ETF holds a special position in the market. There are funds that are more recent additions to the list of options, which have set out to gain market share by passing on fewer administrative costs to investors.
iShares Core S&P 500 ETF (IVV)
The iShares Core S&P 500 ETF is managed by the largest investment manager in the world, Blackrock Inc. Choosing Blackrock as a fund manager offers the additional security of investing with a firm with critical mass – one that got to where it is today by making returns for its clients.
The factsheet Blackrock provides for the iShares Core S&P 500 index fund again affirms the key role such funds can play. Their text encourages investors to “Use (it) at the core of your portfolio to seek long-term growth” (source: Blackrock).
iShares Core S&P 500 ETF Annual Returns
| Year | Annual Returns With Dividends |
| 2017 | 21.79% |
| 2018 | -4.42% |
| 2019 | 31.44% |
| 2020 | 18.37% |
| 2021 | 28.66% |
| 2022 | – |
Source: iShares
Like the SPY fund, the iShares Core S&P 500 ETF is listed on the NYSE Arca exchange. Trading under ticker IVV, it is also one of the bigger funds in the sector, has a market capitalisation $220bn and has been listed since 2002.
iShares Core S&P 500 ETF – Weekly Price Chart – 2010 – 2022
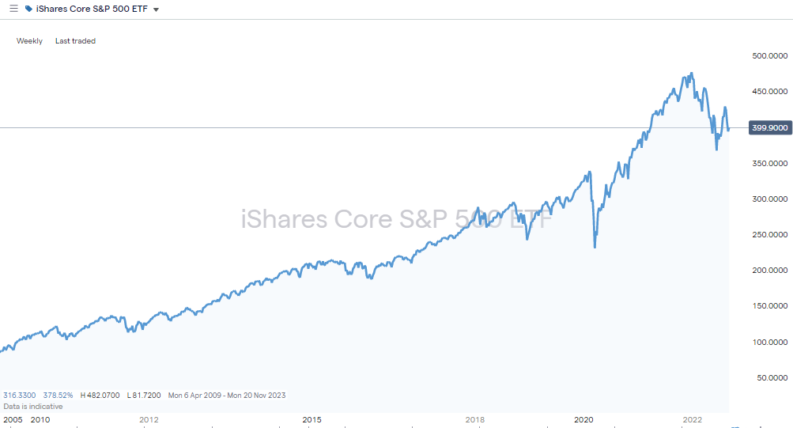
Source: IG
The expense ratio of the IVV S&P index fund is 0.03%, which compares well to that charged by the SPY ETF and goes some way to explaining the slight outperformance in terms of total returns in four of the last five years. The difference, however, is marginal. For every $1,000 invested in SPY, the annual management fee will be $9.45, whereas for IVV, the charge will be $3.
Vanguard S&P 500 ETF (VOO)
As with the other funds mentioned, the Vanguard S&P 500 ETF (VOO) manages a portfolio that holds all stocks in the same capitalisation weighting as the index. It has been listed on the NYSE Arca exchange since 2010, where it trades under the ticker VOO.
The performance of the VOO fund since 2017 is almost identical to that of IVV, largely thanks to them having identical expense ratios.
Vanguard S&P 500 ETF Annual Returns
| Year | Annual Returns With Dividends |
| 2012 | 16.01% |
| 2013 | 32.31% |
| 2014 | 13.64% |
| 2015 | 1.32% |
| 2016 | 12.04% |
| 2017 | 21.74% |
| 2018 | -4.47% |
| 2019 | 31.47% |
| 2020 | 18.40% |
| 2021 | 28.60% |
| 2022 | – |
Source: Vanguard
The minimum investment size is one share, which is good news for investors who are starting out on their trading journey, or those who want to build into a position over time by trading in instalments. As of 7th September 2022, the ETF was trading at a price level where one share could be bought for $365.61.
Vanguard S&P 500 ETF – Weekly Price Chart – 2011 – 2022
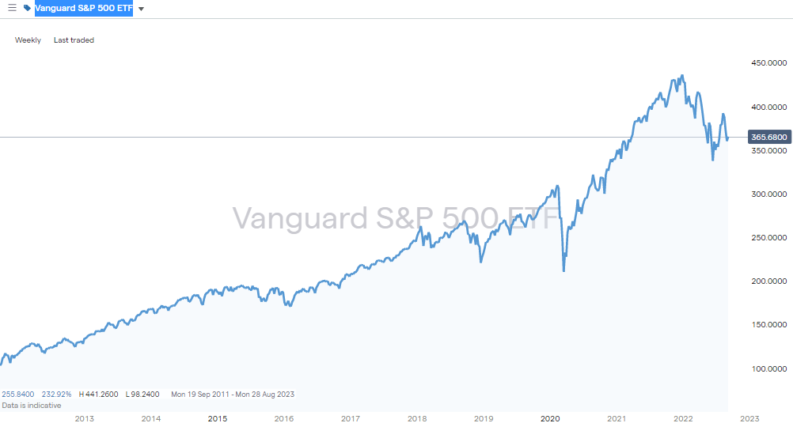
Source: IG
Vanguard’s pitch to investors is that it offers one of the most cost-effective ways to trade funds, such as those that follow the S&P index. The average expense ratio across all Vanguard ETFs is 0.06%, but thanks to the extra liquidity in the S&P 500, the expense ratio for the Vanguard S&P 500 ETF is a very attractive 0.03%.
Final Thoughts
The make-up of the S&P 500 index makes funds that track it a low-maintenance and cost-effective way to invest in 500 of the most profitable firms in the US with the click of just one button. The most popular funds are run by successful fund managers that have long track records of responsible investment, which offers investors additional security.
As a decision to buy the S&P 500 index may well be a long-term one, it is also important to consider the financial health of the broker you choose to hold your position. This list of trustworthy brokers includes firms that have been reviewed by the AskTraders team to ensure they offer high levels of service and are regulated by Tier-1 financial authorities.
Whether you’re new to trading or an experienced investor looking to diversify your portfolio, it’s hard to look past the advice given by Warren Buffet that an S&P 500 fund is the ideal choice of instrument to form a cornerstone of most portfolios.
