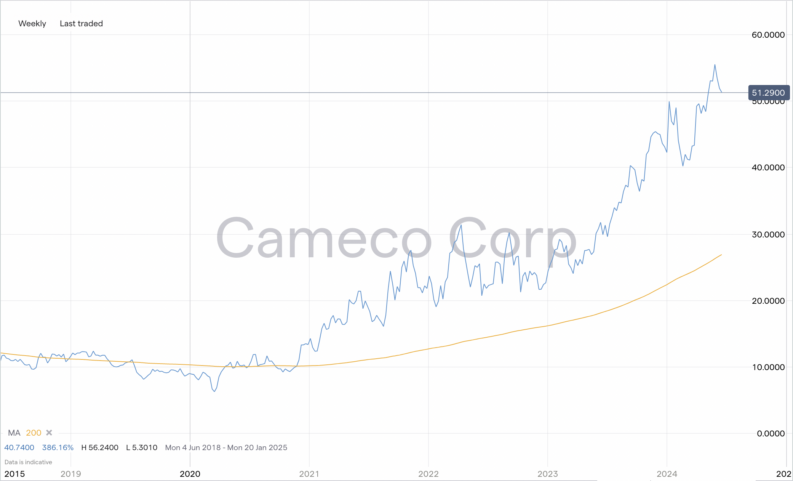
Up more than 22% since the start of the year, Cameco’s stock (NYSE: CCJ) has been one of the better performers on the New York Stock Exchange.
It’s clear there is a strong push to shift the world away from carbon-based energy supplies, which is good news for Uranium mining firms, including Cameco Corp (CCJ). With global leaders continuing to ramp up the shift, the long-term trend is towards alternative energy supplies such as nuclear power being developed.
Cameco, one of the big players in the sector, has seen its share price continue to gain ground.
There are reasons to believe that the upward momentum will continue. Nuclear power has a unique position compared to wind and solar, thanks to it being more reliable. With coal power on the way out, it is a good time to ask the question, is Cameco a good stock to buy? To answer that, this Cameco stock forecast will apply technical and fundamental analysis to outline the short and long-term prospects for the firm.
Where Will Cameco’s Stock Price Be in 12 Months?
The recent moves in the price of CCJ stock raise the question: Will Cameco stock continue to rise or pullback? Short selling at these levels would be a risky proposition. Cameco stock predictions for the next 12 months can incorporate more factors relating directly to the firm’s own actions.
Shorter-term price moves in mineral markets are driven largely by demand factors. A change in view on the move away from carbon-based energy sources can be the result of one line of a political speech. In contrast, the exploration and extraction of uranium is a multi-year project, with little certainty over actual resource levels until mining begins.
It is important to examine what could influence the price of uranium to establish CCJ’s short-term prospects.
Global economic growth and the price of other energy stocks come into play. Geopolitical risk events also have an impact. In addition, any pickup in economic activity is also good for the Cameco share price, as this is associated with increased demand for electricity.
Given that Cameco is a relatively big player in a hot sector, it is fairly well covered by market analysts. They are firmly in the bullish camp, with 11 out of 13 analysts having a Buy rating on the stock (the other two have assigned it a Hold rating). The average price target of over $53 per share represents upside from current levels.
Cameco News
In June, Saskatchewan Power Corporation, Westinghouse Electric Company, and Cameco announced they had signed a memorandum of understanding to assess the potential of Westinghouse’s nuclear reactor technology and the associated nuclear fuel supply chain needed for Saskatchewan’s future clean power needs.
BofA added Nike and Cameco to its US 1 list in June.
In April, Cameco reported Q1 adjusted earnings per share of $0.13. Revenue for the quarter coming in at $634 million, above the consensus of $605.45 million.
In January, Cameco shares rose after the US Department of Energy issued a request for proposals for uranium enrichment services to help determine a reliable domestic supply of fuels using high-assay, low-enriched uranium, which will help reach President Biden’s goal of net-zero emissions by 2050.
Who is Cameco?
Cameco was founded in 1988 and has its head office in Saskatoon, Canada. Its stock is listed on the New York Stock Exchange under the ticker CCJ. The firm operates two divisions, which cover various areas of the uranium industry. The Uranium division engages in exploration, extraction, milling, and buying and selling of uranium. The Fuel Services division operates further down the production process and refines, converts, and fabricates uranium.
The firm operates a global network of mining sites, but many of its operations and reserves are located in North America. The total licensed capacity is currently to produce more than 53 million pounds (100% basis) of uranium concentrates annually, which are backed up by 455 million pounds of proven and probable mineral reserves (source: Cameco).
Nuclear energy divides public and political opinion, and this means that demand for Cameco products can be volatile. CCJ’s proven and probable uranium reserves mean that it is well-positioned to increase capacity if the price of the metal goes on a bull run.
Cameco Long-Term Forecast
Any Cameco long-term stock forecast needs to be based on the price of uranium. A move in the heavy metal should be followed by an exponential move in the price of mining company shares.
Like most mining firms, Cameco’s cost base involves a large percentage of fixed rather than variable costs. Capital investment in exploration projects and the setting up of the infrastructure required to extract minerals is largely front-loaded. Once a new mine is opened, the ongoing running costs need to be managed but can be small in comparison to the cost of getting the operation set up. This means that a small increase in the price of uranium on the open market can lead to a larger percentage increase in Cameco profit margins and a resulting proportionately larger rise in the price of CCJ shares.
The direction of travel in terms of demand for non-carbon electricity is clear to see. Cameco is pitching its products as the answer to the energy problem while, at the same time, global demand for power is increasing. The firm stated that it is ready to supply “safe, reliable, carbon-free nuclear reactors. Together, we are meeting the ever-increasing demand for clean baseload electricity while delivering safe, reliable solutions to today’s clean-air crisis.”
The reference to ‘reactors’ needs to be recognised. Cameco is one of the market leaders in the move towards nuclear reactors being smaller in size. These small modular reactors are a third of the size of traditional plants and make expanding the use of nuclear power more scalable and flexible.
Is Cameco a Good Buy?
With markets in uranium hard to access, buying or selling uranium mining stocks offers investors an indirect way to take a view on the prospects of the nuclear industry. Short-term price drivers tend to be demand-based. A change in political appetite could send the stock tumbling. However, as governments have warmed to nuclear energy, the stock price has performed well in the last few years.
The recent price surge reflects there being few viable, reliable, and predictable alternatives to carbon-based fuels on the market. There are, however, alternative uranium mining stocks to add to the shortlist of candidates. That being said, the positive forecasts from analysts and further tailwinds mentioned above could all come into play over the next five years.