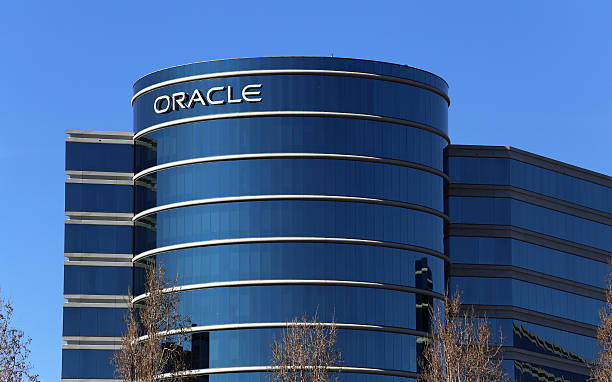


Oracle’s stock (NYSE: ORCL) has been an outperformer through the first half of 2025, putting up gains of 26.6%. With new highs, and a firm break above $200 made, what could be coming through the second half?
The company faces some significant challenges, including intense competition, integration risks, and the need to effectively execute its strategic initiatives. While the prevailing sentiment is positive, it’s important to consider the bear viewpoint and assess whether Oracle’s cloud transformation is truly sustainable and whether its AI investments will deliver the expected returns.
Oracle Corporation Share Price Targets
Analysts have set a 12-month price target for Oracle with an average expectation of $212.87, ranging from a high of $170.00 to a low of $250.00.
The current consensus average target suggests ORCL is fully valued at current levels.
Our View: You would be wise to consider the views of the analyst community in conjunction with the fundamentals surrounding the company to properly determine a value for the stock that you feel is appropriate.
At the upper end of analysts estimates it would be easy to get carried away with the potential gains on show, but the flipside is that these targets can shift within the blink of an eye and that the view of analysts is very dynamic.
If you are considering swing trading, or day trading Oracle shares that is a separate consideration, but for those planning for the long haul, fundamental analysis is king.
Oracle Corporation – The Basics Driving The Business
Oracle Corporation, a titan of the technology world, has been undergoing a significant transformation in recent years, shifting its focus from traditional database software to cloud computing and artificial intelligence (AI). This strategic pivot, coupled with savvy acquisitions and strategic partnerships, has begun to bear fruit, evidenced by recent financial results and a renewed investor enthusiasm. While Oracle’s journey hasn’t been without its challenges, the company’s commitment to innovation and its expanding cloud infrastructure position it as a compelling player in the evolving tech landscape.
For decades, Oracle was synonymous with database management systems, a cornerstone of enterprise IT infrastructure. However, the rise of cloud computing presented both a threat and an opportunity. Recognizing the shifting tides, Oracle embarked on a mission to build out its own cloud offerings, competing directly with established giants like Amazon Web Services (AWS) and Microsoft Azure. This transition has involved substantial investments in data centers, software development, and strategic acquisitions, including companies like NetSuite (cloud-based ERP) and Cerner (healthcare IT).
The past year has been marked by a growing sense of optimism surrounding Oracle’s prospects. The company’s stock performance has reflected this sentiment, driven by a series of positive developments that underscore the success of its strategic initiatives. A key catalyst has been the increasing demand for Oracle’s cloud services, particularly those related to AI. Businesses are seeking robust and scalable infrastructure to support their AI initiatives, and Oracle is positioning itself as a provider of choice.
Oracle is actively expanding its cloud services and embracing a multicloud strategy. The company has launched nine Oracle Database@Azure locations since 2023, with plans to add 24 more regions through its multicloud alliance with Microsoft. This expansion aims to meet the increasing global demand for Oracle’s cloud services and highlights the company’s commitment to providing flexible and scalable cloud solutions.
Oracle introduced the Oracle AI Agent Studio for Fusion Applications, a platform that empowers customers and partners to create, extend, deploy, and manage AI agents across their organizations. This offering, available at no additional cost, builds upon Oracle’s existing AI agents and provides tools for customization and management, including agent template libraries, team orchestration capabilities, and integration with various Large Language Models (LLMs). Major consulting firms like Accenture, Deloitte, and PWC have expressed support for the platform, recognizing its potential to enhance enterprise AI capabilities.
Oracle has secured a contract with Singapore’s Defence Science and Technology Agency (DSTA) to provide an Oracle Cloud Isolated Region, supporting the Ministry of Defence (MINDEF) and the Singapore Armed Forces (SAF). This collaboration will enable MINDEF and the SAF to access high-performance, air-gapped, and secure sovereign cloud computing, data management, and AI services in a secure environment.