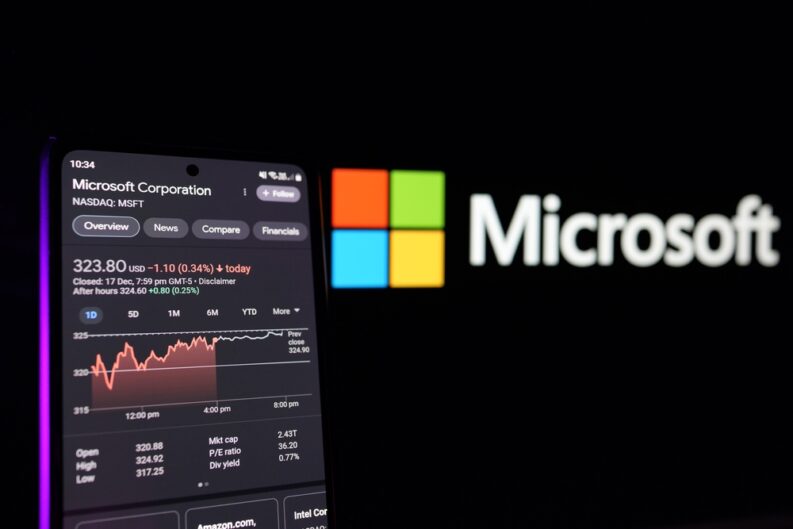
Microsoft’s shares are listed on the Nasdaq under the ticker MSFT. The company’s stock is a component in the three benchmark indexes: the Dow Jones Industrial Average, the S&P 500, and the Nasdaq-100 index. Also a constituent of the ‘Magnificent Seven’ stocks that emerged from the ashes of ‘FAANG’.
Microsoft Corporation is a global technology giant founded in 1975 by Bill Gates and Paul Allen. Renowned for its software products, Microsoft has played a pivotal role in shaping the personal computer revolution.
Technology Industry Comparison
Microsoft has a vast array of products and services, including the world’s most popular desktop operating system, Windows, which powers billions of computers globally. For productivity and creativity, Microsoft offers the widely used Microsoft 365 suite, featuring applications like Word, Excel, and PowerPoint.
Beyond PCs, Microsoft is heavily involved in the gaming industry with its Xbox consoles. The company also produces its own line of devices under the Surface brand. Furthermore, Microsoft Azure has established itself as a top cloud computing platform. More recently, Microsoft has become a leading company in artificial intelligence via its partnership with OpenAI.
Microsoft Share Price & Chart
The emergence of artificial intelligence helped fuel a rally in Microsoft shares more recently. However, despite a dip in 2022, Microsoft’s stock price has been on an upward trajectory for a number of years.
P/E Ratio Average Over the Last Ten Years: 29.58 (Source: FullRatio)
Dividend yield: 0.71%
Microsoft Stock Price Forecast
According to data compiled by TradingView, 54 of 57 analysts covering Microsoft shares have a Buy rating on the stock, while three have a Hold rating.
In a recent client note, analysts at RBC Capital raised the price target for Outperform-rated Microsoft to $500 from $450 per share after hosting the company’s Directors of Investor Relations, James Ambrose and Josh Elvidge. The discussion with Microsoft is said to have left the firm more optimistic about the company’s runway of growth and leadership in AI.
Macquarie also increased the price target on Microsoft to $475 from $460, keeping an Outperform rating on the stock. The firm explained that they believe Microsoft’s global distribution, Azure cloud, and Activision’s 350M gamers will “unlock new subscription and mobile gaming opportunities.” The gaming segment is core to Microsoft’s consumer growth algorithm and Macquarie said the target is increased to reflect “this significant market opportunity.”
Our View: Microsoft is a leading company in various technology sectors, including the rapidly growing AI industry.
The lowest MSFT price target on the street currently of $450 is comfortably above the latest trading price, and the view from the bulls is very much one that has take control in recent times with more than 30% gains in 12 months. A street high target of $600 reflects a significant potential upside, but the momentum in high growth arenas such as AI can swing very quickly.
If you are looking for blue-chip names that can give exposure to AI, within the framework of a company that has many other strings to its’ bow; you could certainly do much worse than Microsoft. Even so, investors interested in assessing the stock further should always research the risks carefully and have solid risk management before deciding whether Microsoft will fit their portfolio.
MSFT Stock Suitability
Microsoft shares can be a good fit for various investor profiles, given how prominent it is. However, the stock still may be better suited to certain types of investors. Here’s who may prefer to own Microsoft shares:
The technology giant is a well-established company with a proven track record of innovation and growth over many years. Investors with a long-term outlook can benefit from Microsoft’s potential for continued growth and stability.
Microsoft has a history of paying dividends, which can provide a steady stream of income. However, the company’s dividend yield is typically lower than that of some other established companies. Investors seeking high-income stocks might want to consider other options alongside Microsoft.
Microsoft remains at the forefront of technological advancements, particularly in cloud computing and artificial intelligence. Investors who expect continued growth in these areas and others Microsoft is focused on may find the company’s stock an attractive holding.
Those who are looking for ethical stocks to own may want to consider Microsoft’s CSR policy, with their track record in this area being very strong.
The stock was once in both the Russell 3000 Value and Growth indexes. However it is now only considered a growth stock at Russell. Investors looking for growth stocks to add to their portfolio may want to consider Microsoft.
Microsoft offers exposure to various segments across the technology sector, which can help diversify a portfolio.