






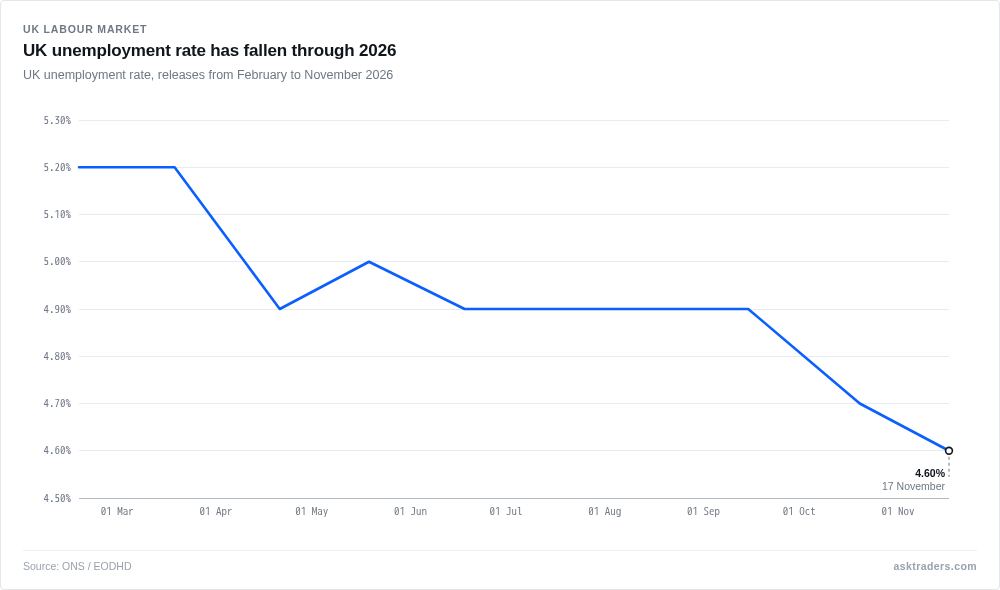
UK unemployment fell to 4.6% in the three months to September, below the 4.7% forecast in the data provider’s calendar. The Office for National Statistics (ONS), the official statistician, published the figures today at 7am UK time. The rate was 5.2% in the February release, so 4.6% is the lowest in the 2026 releases. The ONS cautions that the fall partly reflects survey sampling, and the detail beneath the headline was weaker.
What was announced
The unemployment rate for July to September was 4.6%, down 0.3 percentage points on the year and on the April to June quarter, when it was 4.9%. The employment rate for those aged 16 to 64 was 75.4%, up 0.4 points on the year and 0.3 on the quarter. Economic inactivity, people neither working nor looking for work, stood at 20.8%. The claimant count, which tallies people claiming unemployment-related benefits, was 1.714 million in October.
| Measure | Latest | Previous | Forecast |
|---|---|---|---|
| Unemployment rate | 4.6% | 4.7% | 4.7% |
| Employment change (K) | 156 | 102 | 136 |
| Regular pay growth | 3.5% | 3.7% | 3.6% |
| Total pay growth | 3.6% | 3.8% | 3.5% |
| HMRC payrolls Oct (K) | -34 | 20 | No data |
| Claimant count change Oct (K) | 33.2 | 9.8 | No data |
Employment and unemployment both beat the forecast. Regular pay growth, which excludes bonuses, came in below expectations, while total pay growth, which includes bonuses, came in above expectations despite slowing.
Where sterling stands
We have no intraday data for the minutes after the release, so we make no claim about how the pound or UK shares reacted to it. In today’s session bar, which is still in progress and is not a close, GBP/USD was 1.3192, against 1.31855 at yesterday’s close.
Why the headline flatters the jobs market
The ONS said: “The latest figures provide a mixed picture overall. The employment rate increased and the unemployment rate fell in the latest quarter, though these movements partly reflect particularly large differences in employment status between the groups entering and leaving the survey.”
The Labour Force Survey follows groups of households in rotation. The group that left in June had lower employment and higher unemployment than the group that entered in September, which pulls the measured rate down.
Other data were softer. Payrolled employees, counted from HMRC records, fell by 34,000, or 0.1%, in October to 30.2 million on a provisional estimate. That is 95,000, or 0.3%, lower than a year earlier. Vacancies in August to October were 690,000, down 22,000, or 3.0%, on the quarter.
That is the largest quarterly fall since May to July 2025. They were down 37,000, or 5.0%, on the year, and the lowest outside the pandemic since July to September 2014, when they were 686,000, in the ONS’s wording.
The ONS added: “Feedback from our Vacancy Survey suggests that smaller firms may not be recruiting because of labour costs and other economic conditions.”
Pay growth cools
Regular pay growth slowed to 3.5% from 3.7%, and total pay growth to 3.6% from 3.8%. The ONS put public sector regular pay growth at 5.4% and private sector growth at 3.1%.
What comes next
The next ONS labour market release is due on the 15th of December. Bank Rate is 4% after the Bank of England raised it on the 4th of November.
A cooling labour market raises a question for the Bank’s next step: does a lower unemployment rate that the ONS itself qualifies carry as much weight as falling payrolls, vacancies and pay growth?