

Naspers Limited is a South Africa-based global internet group listed on the Johannesburg Stock Exchange (JSE) whose operating segments include Internet, Video entertainment and Print media.
The Naspers share price (JSE: NPN) has been in a bullish phase in recent years, making solid gains, and marking the stock out as one of South Africa’s blue chip companies, and a reliable dividend payer.
Who Are Naspers?
Naspers Limited is one of the largest technology investors in the world and its companies operate and invest in countries and markets across the world with long-term growth potential.
The group continues to back new business models and looks for opportunities to address big societal needs in markets where it sees the greatest growth potential.
Today, the Naspers group is organised into two areas: its media and internet interests in South Africa, and through Prosus (JSE:PRX), its internet interests outside of South Africa.
The group also has sizeable investments in associates such as Tencent, Mail.ru, MakeMyTrip Ltd, and Delivery Hero.
Naspers Shares – Recent Performance & Data
Naspers reported significant financial growth for the fiscal year ending March 31, 2024. The company achieved an 8% increase in consolidated revenue, reaching US$6.4 billion, driven by strong performances in its core segments, particularly OLX and iFood. Notably, Naspers’ e-commerce sector turned profitable, with a trading profit of US$24 million, marking a substantial improvement from the previous year’s loss of US$435 million.
In a strategic move to enhance shareholder value, Naspers continued its open-ended share-repurchase program, reducing the free-float share count by 21% and generating US$30 billion in value for shareholders. By March 31, 2024, the company had sold 113,092,796 Prosus ordinary shares and repurchased 34,793,336 Naspers N ordinary shares, amounting to US$5.7 billion. Additionally, in May 2024, Naspers appointed Fabricio Bloisi, former CEO of iFood, as Group CEO, effective July 1, 2024, signaling a commitment to leveraging his entrepreneurial expertise to drive future growth.
Naspers Stock Chart – 5 Year
Over the past five years, Naspers has strategically transformed from a traditional media company into a global consumer internet leader. In 2019, it listed its international internet assets through Prosus on the Euronext Amsterdam, enhancing shareholder value and focusing on high-growth sectors like e-commerce, food delivery, and fintech.
The company has actively managed its investment in Tencent, implementing share buyback programs to reduce the discount between its market value and underlying assets. In 2023, Naspers simplified its corporate structure by removing the cross-holding with Prosus, aiming for greater transparency and efficiency. These strategic initiatives have positioned Naspers for sustained growth in the dynamic global internet landscape.
Naspers, The Essentials
Naspers Limited has its headquarters at 40 Heerengracht, Cape Town, 8001, South Africa.
Naspers Limited has more than 25,000 employees and currently serves clients in more than 80 countries.
The current CEO of Naspers Limited is Fabricio Bloisi. Naspers Limited forms part of the Software & Computer Services Industry and the Technology Sector of the Johannesburg Stock Exchange (JSE).
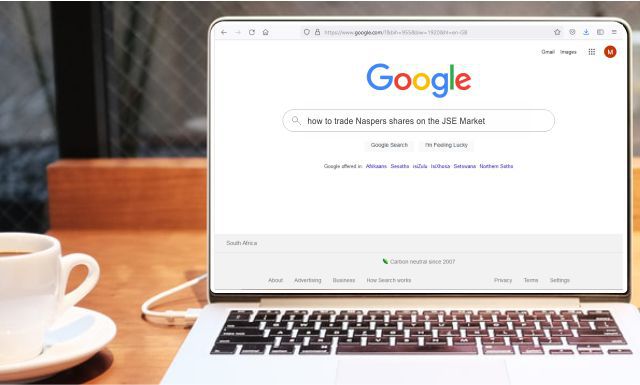
How to buy Naspers Shares – Step by Step
The stock market is one of the most attractive financial markets that sees millions of retail investors and traders’ participating daily. To buy, sell or trade Naspers Limited stocks on the Johannesburg Stock Exchange (JSE), traders and investors can follow a few simple steps:
- Find the share that you want to buy, in this case, “NPN”.
- Select a broker that offers access to the Johannesburg Stock Exchange (JSE).
- Review the broker’s trading conditions, fees, deposit and withdrawal methods, trading platform, customer support, regulation, and other components to ensure that they are aligned with your trading plan.
- Open a live trading account with the broker by completing the online application form and providing the necessary documentation to verify the trading account.
- You are now ready to make your first share purchase through the broker.
- You can further start to build and diversify your portfolio by buying more shares