The Verizon Communications stock price (NYSE: VZ) has spent some time being outshone by firms with higher growth potential; however, with macroeconomic fundamentals shifting, there is renewed investor interest in the stock. Interest rate rises and inflationary pressures weigh heavy on firms that rely on consumers having disposable income. Verizon offers an alternative proposition.
The US-based multinational telecommunications conglomerate has a business model that can smooth out investment returns. The firm’s mobile network is one of the largest wireless carriers in the US. It holds the position of the second-largest US telecommunications company by revenue after AT&T. For investors, that translates into an impressive dividend yield.
The business model pitches offering high-quality and reliable products, and the increasingly important ESG considerations are also taken care of. The firm faces some challenges, but there are also some opportunities. Using technical and fundamental analysis, the Verizon stock forecast below outlines where Verizon shares could be headed in the medium and long term.
Where Will The Verizon Stock Price Be in 12 Months?
Verizon’s networks are associated with long-term contracts that insulate the firm from economic downturns to a greater extent than some of its tech rivals. There are also aspects of a ‘utility sector stock’ about the company, with phone contracts probably being one of the last outgoings on which consumers would consider cutting their spending.
Verizon may not offer the same excitement as some of the more volatile tech stocks in the market, but recent Verizon stock price history confirms it’s not entirely immune to overall weakness in the sector.
Despite the weakness over the past few years, Verizon’s business type and dividend payments provide Verizon shareholders with a solid base and a reliable income stream.
From a technical perspective, many consider the stock oversold even with the recent rise, with the stock well below its December 2019 high of over $62 per share.
Some investors have taken advantage of the slide in Verizon, taking short positions in the stock, with over 1% of its shares shorted at the time of writing. That doesn’t mark Verizon as a poor prospect. Some of the short-selling will be by hedge funds running market-neutral strategies that have gone long on another stock they consider to have better prospects than Verizon.
Overall, Wall Street analysts are split on the stock. According to TradingView, 13 have a Buy rating on VZ shares, 13 have a Hold rating, and one analyst has a Sell rating. The average 12-month price target is $45.04.
Verizon News
In June, VoIP-Pal.com filed new patent infringement lawsuits in the Western District of Texas, Waco Division, against Verizon and T-Mobile, alleging infringement of two of VoIP-Pal’s “Routing, Billing, and Rating” patents.
In May, the Department of the Navy selected Verizon Public Sector to supply wireless devices and services through the Wireless and Telecommunications Services contract vehicle. The multiple award contract’s total value is up to $2.67 billion over 10 years.
The Wall Street Journal reported in May that T-Mobile and Verizon are in discussions to carve up U.S. Cellular in separate transactions that would provide both buyers access to valuable airwaves. The report explains that T-Mobile is closing in on an agreement to acquire a piece of the regional carrier for over $2 billion. The deal, according to the WSJ, will reportedly see it take over some operations and wireless spectrum licenses. Meanwhile, talks with Verizon on a separate deal are expected to take longer or might not result in an agreement.
Also in May, AST SpaceMobile and Verizon announced a strategic partnership with a commitment of $100 million from Verizon to deliver direct-to-cellular AST SpaceMobile service when needed for Verizon customers
Where is Verizon Stock Listed (NYSE: VZ, NASDAQ: VZ)?
Verizon traces its history to a substantial and government-led re-organization of US telecom operators. In 1984 the US Department of Justice initiated a breakup of AT&T’s network on competition grounds, and a range of smaller operators, ‘Baby Bells’, were formed. The economies of scale in the industry are hard to resist, and thanks to rounds of takeovers and acquisitions, these smaller firms merged back into larger firms. Verizon was created out of a rebranding of Bell Atlantic, which by 2000 had built itself back into a telecoms operator with a nationwide reach and 132,200 employees.
Deals carried out in 2015 saw Verizon branch out into content ownership by buying AOL and Yahoo! This experimental push into new business lines came to an end in 2021 when both firms were sold to hedge fund Apollo Global Management for $5bn. That signified a decision by the firm to focus on its core networks operations and the impending rollout of 5G mobile communications.
Verizon is a constituent part of the blue-chip Dow Jones Industrial Average index and can be traded on the NASDAQ and New York Stock Exchange, though its primary listing is on the NYSE.
Verizon Long-Term Forecast
Extending the Verizon stock forecast provides more reasons to buy Verizon than sell at the moment.
Any stock that can ride out uncertainty associated with COVID-19 and the many other macroeconomic and geopolitical pressures on the economy deserves consideration. It might not generate life-changing returns, but it offers some stability as part of a well-diversified investment portfolio.
The income streams the firm generates are impressive and stable.
Those looking to the long term will note the company’s heft debt load, which has weighed on the stock, with some investors considering it to be risky. This has more than likely prevented many investors from adding it to their portfolio and is definitely a risk to consider if you are thinking about investing in the stock.
Verizon Share Price
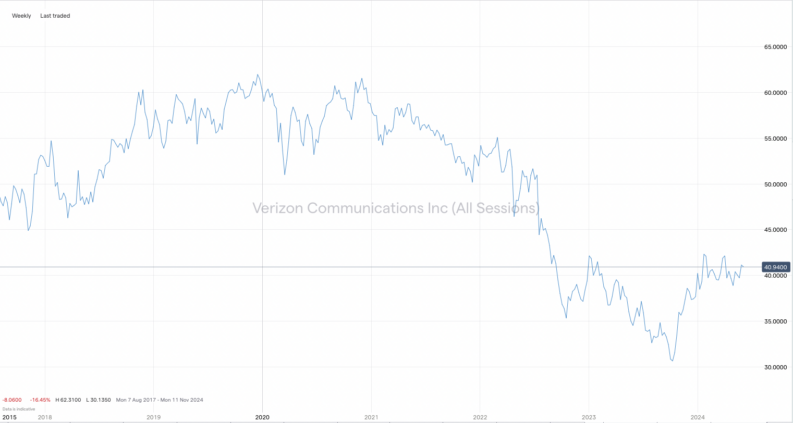
In September of 1999, in the heat of the dot-com bubble, Verizon printed an all-time high price of $68.18. The VZ stock price isn’t likely to test that level in the immediate future; its stock history is more about ‘slow and steady’ winning the race. However, it can’t be dismissed by investors running long-term, buy-and-hold strategies.
Is Verizon a Good Stock to Buy?
Those asking the question as to whether Verizon is a good stock to buy would benefit from considering the existing structure of their investment portfolio. Verizon would complement most portfolios, particularly those skewed toward more speculative strategies. A stock position that smooths out returns can help take the emotion out of trading and allow traders to ride out unavoidable dips in the market.