- Gold rallies to highest price levels for six years
- A ‘perfect storm’ of events taking place
- Now in line with the S&P 500 on a ytd basis
- Bitcoin and gold also trading in line over the previous week
- Some analysts suggest it could be time to take profits
Gold futures prices have demonstrated what happens when the three main drivers of the metal all push the price in the same direction. Online site Kitco’s senior technical analyst summarised on Friday:
“Gold bulls have a three-pronged assault force working for them: heightened geopolitical risks, bullish technical charts and notions of easier money policies coming from the major central banks of the world in the months ahead.”
Source: Kitco
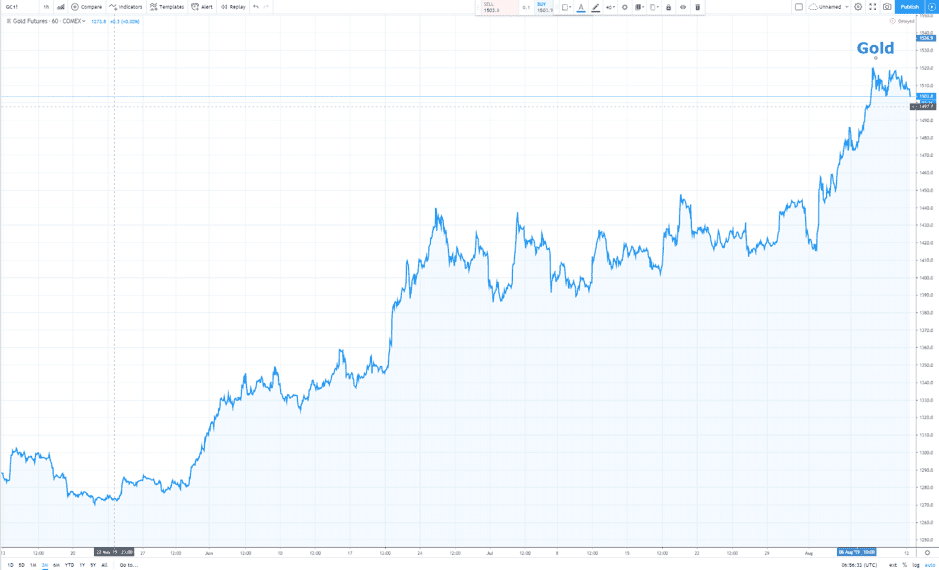
Gold futures are currently trading at levels not seen for six years. The recent bull-run has seen price increase by 16.62% over the last three months and by 5.91% since the beginning of August.
Gold Futures (GLC1!) – Three month price chart
Geo-political risk
The decision made by the People’s Bank of China on 5th August to peg the Chinese yuan at over $7 has ramped up the geo-political risk facing the global economy. The financial markets responded in a textbook manner with risk assets such as equities selling off and gold futures rallying. There is now uncertainty about how the daily pegging will play out – there are questions about how traders will manage such a key variable on a day-to-day basis. There is also an awareness that the US-China trade war will now be even harder to unravel. The even bigger driver of a rotation away from risk was that extent to which the PBOC move caught the markets off guard.
There is a considerable undercurrent of uncertainty stemming from such things as potential conflict in the Straits of Hormuz and Brexit, but these can be considered and analysed almost at one’s leisure. The devaluation, however, asks a different question that is harder to answer – if there is one ‘unknown’ out there, are there more? This has spooked the markets.
Interest rates
Dovish guidance from the world’s central banks has been backed up by significant interest rate cuts.
Last week, central bankers from India, Thailand, Serbia and the Philippines all cut their respective country’s base rates. The Reserve Bank of New Zealand surprised the markets and cut its rates by 50 basis points rather than the anticipated 25 basis points. The European Central Bank and Reserve Bank of Australia are widely expected to announce a further loosening of monetary policy at their next meetings.
The cycle of rate cutting is now confirmed and the US Fed appears as locked in as the other central banks. The CME Fed Watch tool (found here) is signalling that markets think it is 88% likely that US rates will be cut by 25 basis points when the Fed meets in September.
Even before the yuan devaluation, the yield on the German 10 year note was negative, -0.5%. As one analyst said, ‘remember it costs money to hold bonds as well’, so paying administrative costs to hold bonds that redeem at a lower value than an investor paid for them puts the ‘costs’ of holding gold into a different light.
Technicals
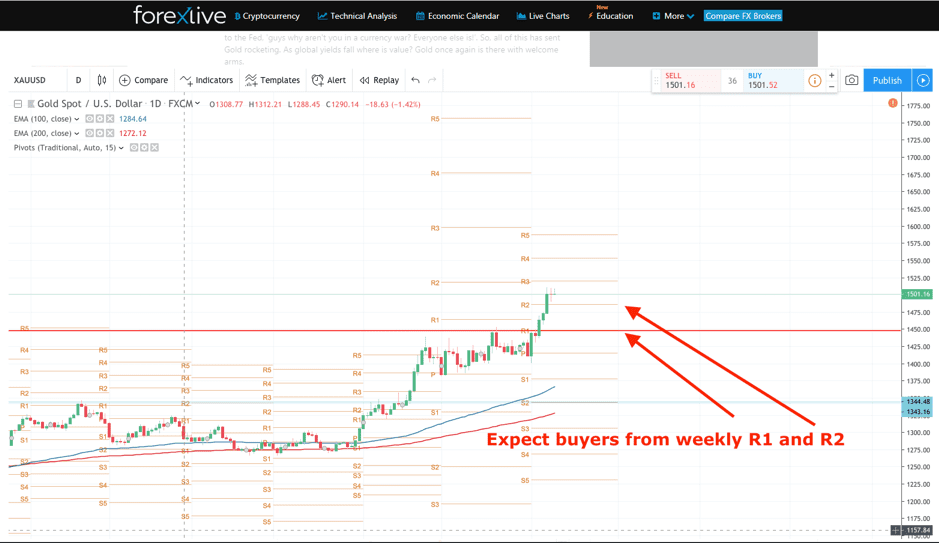
Industry site ForexLive has run technical analysis of the current price action in gold. With price now above the psychologically important $1,500 level, some kind of fall back to test that level can be expected.
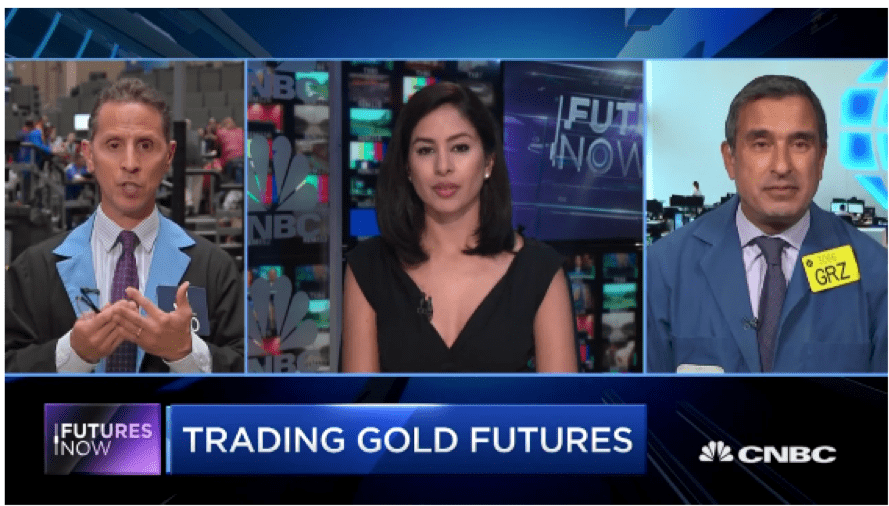
Some analysts think the current bull-run is due a due a breather. Pit traders speaking on CNBC ‘Futures Now’ discussed the break through $1,500 and noted the resistance at $1,505.
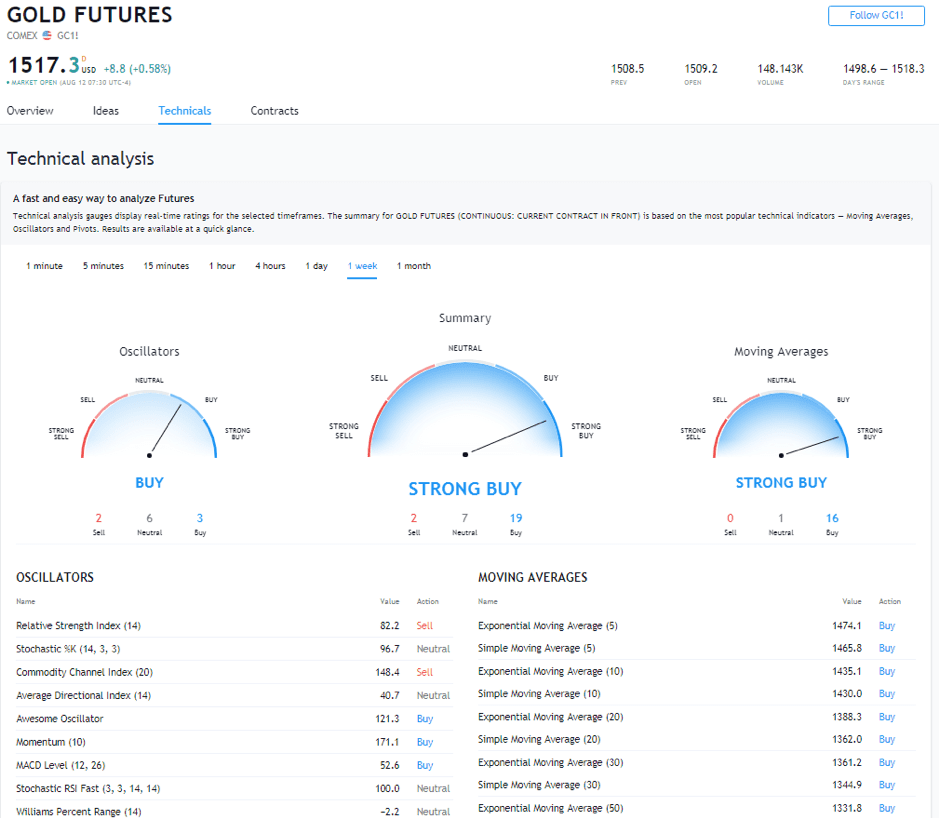
Daily and weekly technicals from TradingView are still pointing to the buy side, which suggests active shorting might be hard to time. There is always the chance of a last drive upwards that clears out the stop losses on premature short positions. Those holding the asset in a long position may well be considering taking some profits.
Weekly technicals – TradingView
A longer term analysis is provided by Nancy Tengler of Tengler Wealth Management. Speaking with CNBC, she referred to the historical trend for gold to lag the S&P 500 by 10% per annum. That spread has momentarily tightened with gold and the S&P 500 trading flat on a year-to-date basis.
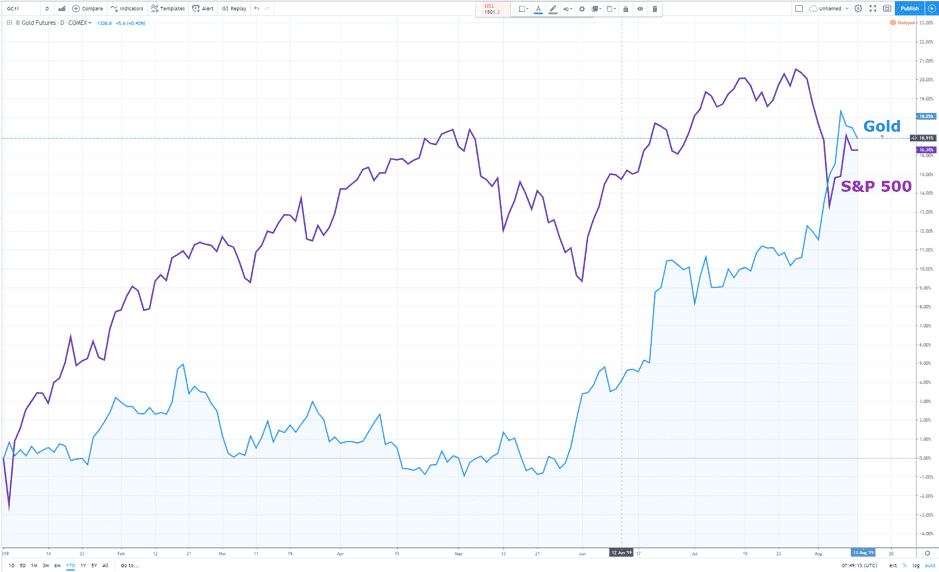
Tengler is of the opinion that “things will consolidate; we’ll ultimately get a China deal” (source: CNBC). The quality of the deal is less important than the fact that there is some kind of handshake over the table.
There are of course those that have a difference of opinion to Tengler. Phil Streible, senior market strategist at RJO Futures, was speaking to Kitco when he said:
“Gold looks pretty good to the upside. The two-day consolidation that we had was healthy for the markets… All that overbought territory means that it is in a bull market… The strength of this bull market is increasing. There’s no telling how high it can go. If we break through the high of $1,516, we can see an explosive move to $1,550.”
Source: Kitco
Old gold vs new gold
The price move of last week marked an interesting development in the theory that cryptocurrencies are developing into a quasi-gold style asset.
The five-day chart shows how bitcoin and gold futures ended the week with prices very close to each other. There were also three notable retreats by BTC to touch the gold price and find support at that level. Price action shows that fans of BTC see it ‘at least as good as gold and probably better’.
Gold futures/bitcoin – Five day
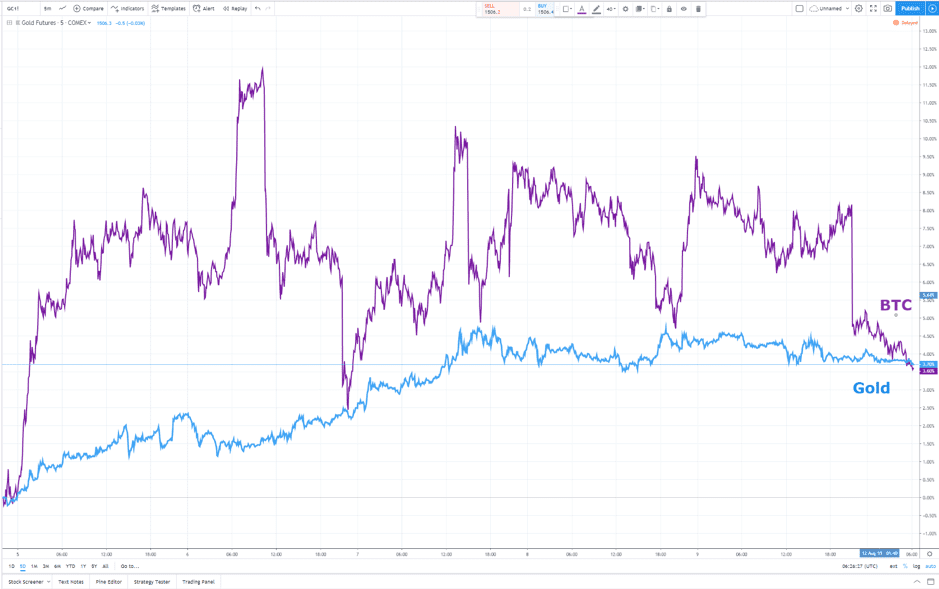
The same comparison over a longer time scale highlights the outperformance of BTC over gold. On a year-to-date basis, BTC has outperformed gold futures by approximately 200 percentage points.
Gold futures/bitcoin – YTD
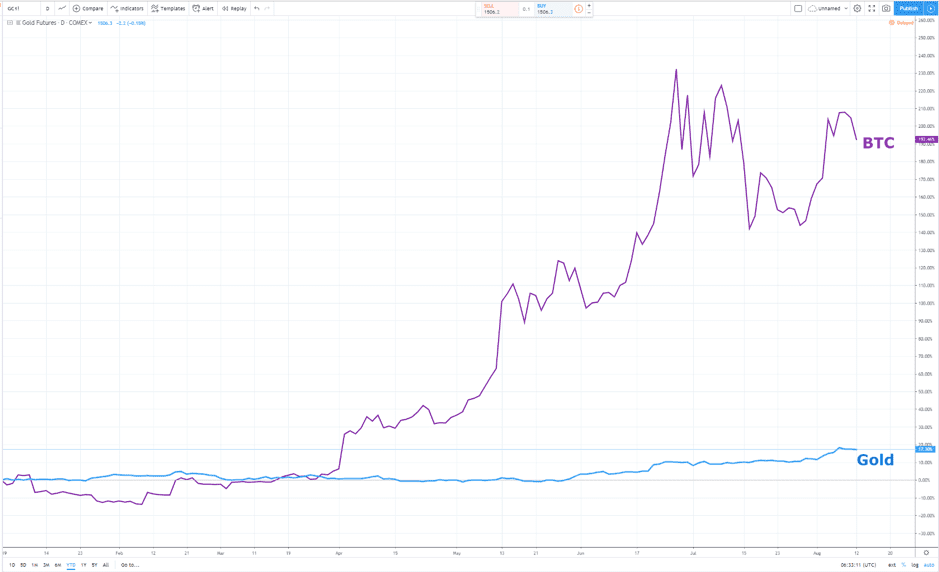
The closer correlation over the last five days of trading came after the devaluation of the yuan by China on 5th August. The event caught the markets off guard and geo-political risk became about fear of uncertainty rather than a rational assessment of possible outcomes. To put it another way, when things get serious, the spread between BTC and gold is tighter. At other times, BTC price action is driven to a greater extent by its ‘crypto-style’ features, ‘the currency of the future, rather than the one of the past’.
