
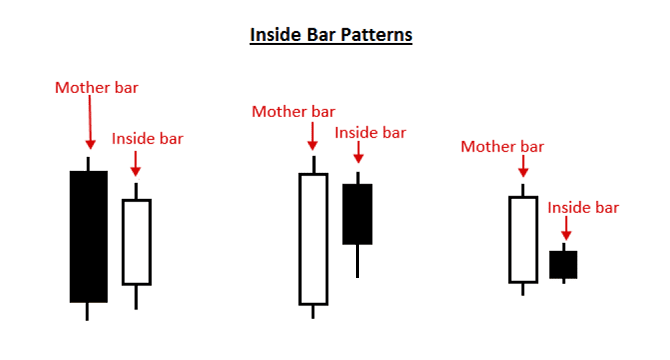
Inside Day candlestick formations create a two-bar price pattern, where the price range of the second trading day is completely contained within the range activity that was present during the first trading day. Essentially, this means that the price high of Day 2 is below the price high of Day 1 and the price low of day 2 is higher than the price low of Day 1. Since the entire trading stance is based on the trading range of Day 1, traders will sometimes refer to the first price bar as the “Mother” bar and the second price bar as the “Inside” bar:
From a market perspective, Inside Day patterns indicate a contraction in trading volatility. This can also be understood as a period of indecision after a strong move in the market (signified by the long, solid candle established on the first day). However, some traders actually dismiss inside trading days because they are fairly common and may not possess the same strength that a rare technical analysis chart pattern might otherwise offer. Additionally, traders should note that the concepts which define inside trading days can also apply to weekly or monthly periods. In these cases, traders might refer to an “inside trading week” or an “inside month” and the same concepts would apply to those topics.
Chart Example: Inside Day Candlestick Patterns
Inside Day candlestick patterns are excellent for traders of all experience levels because they are fairly simple in design and they also offer an easy way to place stop-loss orders on each position. Furthermore, Inside Day patterns are often associated with a slowdown in market volatility (also referred to as a period of “consolidation”). This means traders are less likely to encounter extreme trading volatility in the ways that might be encountered when using a breakout trading strategy or a momentum trading strategy.
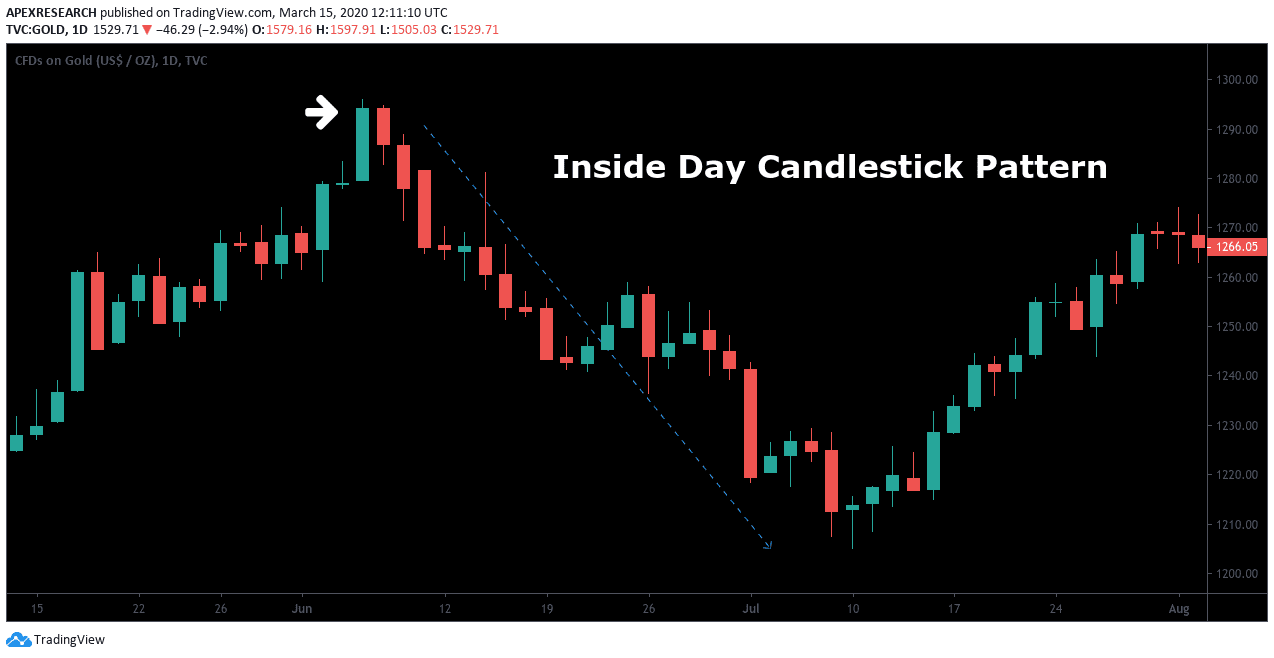
In this chart example, the Inside Day pattern signaled a bearish end to what had been a small uptrend. The Inside Day period indicated a slowdown in momentum and traders that were long the asset might consider closing positions given the limited outlook for bullish follow-through. In contrast, aggressive traders might use these developments to initiate new short positions in the asset. In this case, stop losses should be placed above the price high in the Japanese candlestick formation. This protects traders from unexpected rallies in the event an Inside Day trading pattern starts to break down and produce losses. As a basic trading strategy, the Inside Day candlestick pattern offers a simple way of assessing the market and spotting the end of a major price trend.
Ask Traders Summary: Inside Day Candlestick Patterns
- Inside Day patterns are relatively common candlestick formations, and they occur over a two-day trading period. Traders will sometimes refer to the first price bar as the “Mother” bar and the second price bar as the “Inside” bar.
- The rules of these patterns state that the price high and price low of the session occur within the price high and low recorded during the previous trading day.
- Traders will sometimes see price breakouts that follow the occurrence of an Inside Day pattern.
- In these cases, high probability trades tend to align with the dominant trends visible in the market.
- In active trading, stop-loss orders should be placed above the price high in the Japanese candlestick formation in bearish scenarios, and above the pattern formation in bullish scenarios.
Useful Pages:
Compare Stock Brokers | Compare Forex Brokers | Compare CFD Brokers
PEOPLE WHO READ THIS ALSO VIEWED:


