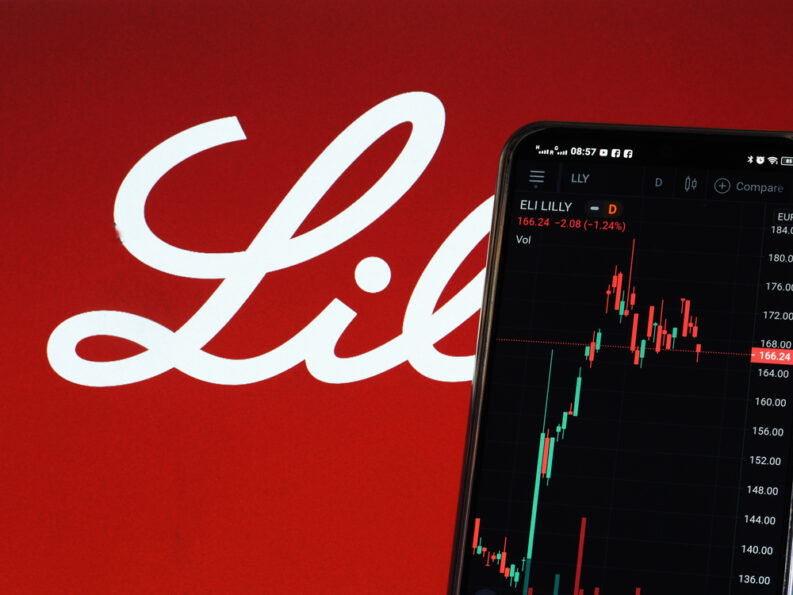
Eli Lilly’s stock price (NYSE: LLY) has been trending lower this year after a huge run up, down 7.12% YTD ahead of this morning’s earnings. Despite the pause, the stock remains 21.47% higher on a 1 year basis, and 60% higher than the August low, just 6 months ago. Expectations are raised into the print.
$899.6B
49.3
$5.89
$16.1B
Eli Lilly reports fourth-quarter 2025 results market open. The quarter provides the first full read on whether incretin revenue growth can scale with stable net pricing and durable margin structure following three consecutive quarters of upward guidance revisions. C
 WELCOME BONUS - Free Share Bundle When You Invest £50!
Get up to £500 cashback for investing with IG.
WELCOME BONUS - Free Share Bundle When You Invest £50!
Get up to £500 cashback for investing with IG.
onsensus sits at $5.89 adjusted EPS and $16.1B revenue, both below the company’s most recent FY25 guidance midpoint of $23.35 EPS and $63.25B revenue, creating a setup where the reported quarter matters less than the 2026 outlook framework.
The Q3 beat of $7.02 versus $5.89 consensus drove only a mid-single-digit premarket reaction, signaling that investors now discount operational strength and trade pipeline optics, competitive positioning, and net pricing trajectory.
The result will determine whether Lilly can sustain the valuation premium embedded in its 49.3x trailing P/E ratio, 73% above the sector median.
A beat that merely confirms the existing guide without addressing 2026 growth durability, oral GLP-1 commercialization timing, or formulary access resolution risks a sell-the-news response. Conversely, guidance that frames 2026 incretin volume growth with stable gross-to-net realization and performance margins near the Q3-guided 45-46% range would support the current multiple and validate the bull thesis that Lilly’s GLP-1 franchise represents a multi-year structural growth story rather than a peak-demand cycle.
Consensus Estimates
| Metric | Consensus Est. | Range | Prior Guidance | YoY Change |
|---|---|---|---|---|
| EPS (Adjusted) | $5.89 | $5.49 – $7.21 | $23.00 – $23.70 (FY25) | +399.3% |
| Revenue | $16.07B | $15.41B – $16.43B | $63.0B – $63.5B (FY25) | +40.5% |
| Mounjaro Sales | $6.65B | N/A | N/A | N/A |
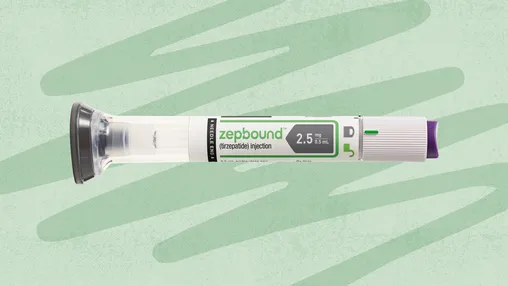
| Zepbound Sales | $3.90B | N/A | N/A | N/A |
Analysts Covering: 19 (EPS) / 20 (Revenue)
Estimate Revisions (30d): 0 up / 0 down (EPS); 13 up (Revenue)
Consensus expectations for Q4 2025 sit materially below the implied quarterly run rate from Lilly’s most recent FY25 guidance. The company’s Q3-raised guide called for $63.0-63.5B revenue and $23.00-23.70 adjusted EPS for the full year. With three quarters already reported totaling $45.89B revenue and $16.67 adjusted EPS, the guidance implies Q4 revenue of $17.11-17.61B and adjusted EPS of $6.33-7.03. Street consensus of $16.07B revenue and $5.89 EPS falls below the midpoint on both metrics, suggesting either conservative modeling or skepticism that the company can sustain the acceleration implied by its own framework.
Estimate momentum shows a notable divergence. Revenue revisions have moved uniformly higher over the past 30 days, with 13 upward adjustments and no downward changes, reflecting confidence in incretin volume conversion. EPS revisions, however, have stalled completely, with zero changes in either direction and the consensus estimate revised 8.57% lower over the period. This pattern indicates analysts are modeling top-line strength but embedding margin compression or below-the-line headwinds, consistent with management’s Q1 2025 guidance cut tied to deal-related charges and ongoing gross-to-net pricing pressure.
The estimate range on adjusted EPS spans $5.49 to $7.21, a 31% spread that reflects material uncertainty around net pricing realization, product mix, and one-time items. The wide dispersion creates a scenario where Lilly could beat consensus by 10-15% and still land within the range of existing estimates, muting the informational value of the reported number relative to the forward guide.
GLP-1 franchise now represents approximately 50% of Lilly’s total revenue
Management Guidance and Commentary
“We raised our full-year 2025 revenue guidance to $63.0 billion to $63.5 billion and adjusted EPS guidance to $23.00 to $23.70, reflecting continued strong demand for our incretin medicines and improved operational performance.”
Management’s Q3 2025 guidance raise marked the second upward revision of the year, lifting the FY25 revenue midpoint from $59.5B at year-end 2024 to $63.25B by Q3, a $3.75B or 6.3% increase. The adjusted EPS midpoint moved from $23.25 to $23.35 over the same period, a more modest 0.4% lift that reflects the margin and pricing headwinds offsetting volume growth. The company explicitly framed the revenue increase as driven by volume for Mounjaro and Zepbound, with supply expansion enabling higher dose conversion, while acknowledging that realized pricing remained under pressure from rebates and Part D changes.
The guidance trajectory over 2025 illustrates how Lilly has consistently exceeded its own expectations on the top line while managing earnings growth more conservatively. The Q1 2025 guide cut, which lowered adjusted EPS to $20.78-22.28 from the initial $22.50-24.00 range, was attributed to deal-related charges and investment marks rather than operational weakness. That reset forced the Street to separate core demand signals from below-the-line noise, a dynamic that has persisted through subsequent quarters as management has raised revenue guidance twice while keeping EPS guidance increases more restrained.
The gap between management’s implied Q4 guide and Street consensus creates asymmetric risk. If Lilly reports at the low end of its own guidance range, it would still beat consensus revenue by 6.5% and consensus EPS by 7.5%. A miss relative to the company’s guide, however, would likely trigger a more severe reaction than a beat relative to consensus, as it would raise questions about whether the upward guidance revisions throughout 2025 were overly aggressive or whether Q4 execution faltered. The market’s focus has shifted from whether Lilly can beat quarterly estimates to whether it can sustain the growth trajectory implied by its own raised framework.
Analyst Price Targets & Ratings
Wall Street maintains a bullish stance on Lilly, with 83% of analysts rating shares a Buy or Strong Buy. The consensus target of $1,150 implies 14.6% upside from current levels, though individual targets range from $950 to $1,350 based on varying assumptions about GLP-1 market penetration and competitive dynamics.
Sector & Peer Comparison
| Company | Ticker | Market Cap | P/E | Fwd P/E | Profit Margin |
|---|---|---|---|---|---|
|
Eli Lilly and Company
⭐ Focus |
LLY | $899.6B | 49.3 | 30.1 | 31.0% |
|
Novo Nordisk A/S
|
NVO | $385.2B | 32.4 | 24.8 | 38.5% |
|
Johnson & Johnson
|
JNJ | $362.1B | 15.2 | 14.3 | 17.8% |
|
Merck & Co.
|
MRK | $248.3B | 14.1 | 12.9 | 22.4% |
|
AbbVie Inc.
|
ABBV | $312.7B | 38.2 | 15.6 | 18.9% |
|
Pfizer Inc.
|
PFE | $147.9B | 9.8 | 9.2 | 14.2% |
Lilly trades at a 52% premium to Novo Nordisk on trailing P/E and a 21% premium on forward P/E, despite Novo holding a higher profit margin of 38.5% versus Lilly’s 31.0%. The valuation gap reflects the market’s assessment that Lilly’s incretin franchise is scaling faster and with greater durability than Novo’s, driven by Mounjaro’s Type 2 diabetes indication and Zepbound’s obesity positioning. The forward P/E compression to 30.1x from 49.3x trailing indicates analysts are modeling significant earnings growth acceleration in 2026, consistent with the Street’s $33.30 FY26 EPS estimate representing 41% growth over the $23.62 FY25 consensus.
Relative to the broader large-cap pharma peer set, Lilly’s 49.3x trailing P/E sits more than 3x the multiple of Merck (14.1x) and Johnson & Johnson (15.2x), and 29% above AbbVie’s 38.2x despite AbbVie facing its own patent cliff dynamics with Humira. The premium is justified by growth, Lilly’s 40.5% year-over-year revenue growth in Q4 consensus compares to mid-single-digit growth for most peers, but it embeds minimal tolerance for execution missteps or competitive share loss. A scenario where Novo Nordisk’s oral Wegovy approval in December 2025 accelerates market share gains would compress Lilly’s relative multiple, as the “first-mover advantage” narrative that supported the valuation premium would erode.
The profit margin positioning at 31.0% trails Novo’s 38.5% but exceeds the broader peer set, reflecting Lilly’s incretin franchise mix offsetting lower-margin legacy products. Management’s Q3 commentary on performance margins guided to 45-46% on a non-GAAP basis, suggesting the reported GAAP margin understates the core profitability of the growth drivers. Sustaining or expanding that performance margin framework in 2026 guidance will be critical to defending the forward P/E multiple, as any indication of margin compression from pricing concessions or promotional intensity would trigger multiple contraction despite continued top-line growth.
Earnings Track Record
| Quarter | EPS Actual | EPS Est. | Result | Surprise % |
|---|---|---|---|---|
| Q3 2025 | $7.02 | $6.37 | Beat | +10.2% |
| Q2 2025 | $6.31 | $5.59 | Beat | +12.9% |
| Q1 2025 | $3.34 | $3.54 | Miss | -5.6% |
| Q4 2024 | $5.32 | $5.07 | Beat | +5.0% |
| Q3 2024 | $1.18 | $1.47 | Miss | -19.7% |
| Q2 2024 | $3.92 | $2.60 | Beat | +50.8% |
| Q1 2024 | $2.58 | $2.46 | Beat | +4.9% |
| Q4 2023 | $2.49 | $2.22 | Beat | +12.2% |
Lilly’s 60% beat rate over the past 20 quarters masks a more recent pattern of consistent outperformance. The company has delivered four consecutive adjusted EPS beats since Q4 2024, with an average surprise of 9.8% over that period, well above the 7.4% long-term average. The Q1 2025 miss at -5.6% was the only shortfall in the past eight quarters and was attributed to deal-related charges rather than operational weakness, as revenue beat expectations by $60M despite the EPS miss.
The magnitude of beats has accelerated as the incretin franchise has scaled. Q2 2024’s 50.8% surprise and Q3 2023’s 176.9% surprise (from a low base) reflect quarters where Mounjaro and Zepbound demand materially exceeded Street models. More recent beats have compressed to the 10-13% range, suggesting analysts have recalibrated models to incorporate higher incretin contribution, reducing the likelihood of outsized surprises but also raising the bar for what constitutes a meaningful beat.
The track record shows that guidance direction matters more than the quarterly beat itself. Q2 2025 delivered a 12.9% EPS beat and raised FY25 guidance, yet the stock dropped 14% on oral GLP-1 trial optics. Q3 2024 missed by 19.7% but the stock rose 0.8% the next day, as investors looked through the quarter to pipeline developments. This pattern establishes that the upcoming Q4 result will be traded primarily on the 2026 outlook framework and any updates on orforglipron regulatory timing, formulary access resolution, or retatrutide trial readouts, rather than on whether adjusted EPS comes in at $5.89 or $6.50.
Post-Earnings Price Movement History
| Date | Surprise | EPS vs Est. | Next Day Move | Price Change |
|---|---|---|---|---|
| Q3 2025 | +10.2% | $7.02 vs $6.37 | +13.6% | $726.51 to $825.42 |
| Q2 2025 | +12.9% | $6.31 vs $5.59 | +0.1% | $775.45 to $775.90 |
| Q1 2025 | -5.6% | $3.34 vs $3.54 | -2.1% | $822.51 to $805.23 |
| Q4 2024 | +5.0% | $5.32 vs $5.07 | +0.5% | $773.84 to $778.07 |
| Q3 2024 | -19.7% | $1.18 vs $1.47 | +0.8% | $877.79 to $884.48 |
The average next-day move of 2.2% understates the dispersion in recent reactions. Q3 2025’s 13.6% surge following a 10.2% beat represents the largest single-day gain in the dataset, driven by the combination of a material beat, raised guidance, and improved margin commentary. That reaction contrasts sharply with Q2 2025’s 0.1% move despite a 12.9% beat and guidance raise, as oral GLP-1 trial data dominated the narrative and compressed the stock 14% intraday before recovering.
The pattern shows that beats alone do not drive sustained price appreciation. Q4 2024’s 5.0% beat generated only a 0.5% next-day move, while Q3 2024’s 19.7% miss was followed by a 0.8% gain. The common thread in muted reactions is that the market looked through the quarterly result to forward-looking signals. Q4 2024’s modest reaction reflected that the beat was in line with the trajectory established in prior quarters, offering no new information. Q3 2024’s positive reaction on a miss reflected investor focus on pipeline developments and management’s framing of the shortfall as transitory.
The Q3 2025 reaction establishes the current playbook. The 13.6% surge was driven not by the beat itself but by management’s ability to articulate a credible path to sustained growth with improving margins. The quarter delivered revenue 9.7% above consensus, raised FY25 guidance for the second time, and provided non-GAAP performance margin targets of 45-46% that exceeded prior expectations. That combination of top-line beat, raised guide, and margin expansion framework created the conditions for a re-rating. A Q4 result that lacks any of those three elements, even if it beats consensus, risks a sell-the-news response.
Lilly shares have delivered strong returns despite recent volatility around earnings events
Expected Move & Implied Volatility
42%
68%
38%
The options market is pricing a 6.5% expected move through the earnings event, materially above the 2.2% average historical next-day move but below the 13.6% realized move in Q3 2025. The implied volatility of 42% sits at the 68th percentile of the past year’s range, indicating options traders are embedding above-average uncertainty but not extreme event risk. The 4-point premium of implied volatility over 30-day historical volatility of 38% reflects specific concerns around the earnings catalyst rather than broad market volatility.
The expected move range of $938 to $1,069 brackets the current analyst consensus price target of $1,150, suggesting the options market is pricing a scenario where even a strong result with positive guidance would leave the stock below the Street’s base case. That setup creates asymmetry. A result that drives the stock to the upper end of the expected range at $1,069 would still imply 7% upside to consensus targets, leaving room for multiple expansion if the 2026 guide exceeds expectations. Conversely, a move to the lower bound at $938 would represent a 6.5% drawdown and likely trigger target cuts, as it would imply either a material guide miss or deteriorating competitive dynamics.
The elevated IV percentile at 68% compared to the 50% median reflects two specific risks embedded in options pricing. First, the December 2025 approval of Novo Nordisk’s oral Wegovy introduced a new competitive variable that has not yet been reflected in a full earnings cycle. Second, Lilly’s own orforglipron regulatory filing in December 2025 creates binary risk around approval timing and commercial positioning commentary. The combination of competitive and pipeline uncertainty drives the premium in implied volatility, as options buyers are willing to pay elevated prices for protection or leverage around the event.
Expert Predictions & What to Watch
Key Outlook: Cautiously Bullish
The bull case rests on Lilly’s ability to convert the demand strength evident in Q3’s 53.9% year-over-year revenue growth into a 2026 framework that sustains 20%+ top-line growth while defending or expanding the 45-46% non-GAAP performance margin guided in Q3. The company’s track record of upward guidance revisions throughout 2025, combined with improving supply from ramped U.S. production and the pending Medicare coverage expansion potentially reaching 25 million beneficiaries, supports a scenario where 2026 consensus of $77.56B revenue (21.5% growth) proves conservative. UBS analysts’ characterization of Lilly as the “best growth story for 2026-2030” reflects this view, anchored in the incretin franchise’s structural growth drivers and the pipeline optionality from retatrutide and orforglipron.
The bear case centers on three constraints. First, the CVS Caremark formulary exclusion of Zepbound effective July 1, 2025 drove sequential prescription declines in Q3 and has not been resolved, creating a structural headwind to market share that could intensify if other payers follow. Second, Novo Nordisk’s oral Wegovy approval in December 2025 gives the competitor a first-mover advantage in the oral GLP-1 market, potentially eroding Lilly’s positioning even if orforglipron receives approval in 2026. Third, the 49.3x trailing P/E multiple embeds expectations for flawless execution and sustained growth acceleration; any indication of margin compression from pricing concessions, promotional intensity, or mix shift would trigger multiple contraction despite continued top-line growth.
The setup favors a bullish outcome if management can address the formulary access issue and provide clarity on orforglipron’s commercial launch timing. The stock’s 3.9% decline on the day before earnings and 2% year-to-date underperformance relative to broader market gains suggests some de-risking has occurred, creating a lower bar for a positive reaction than existed at Q3. However, the forward P/E of 30.1x still prices in significant growth, and a guide that frames 2026 revenue growth below 20% or performance margins below 44% would likely drive a sell-the-news response even if Q4 results beat consensus.
Key Metrics to Watch
The combined Mounjaro and Zepbound revenue figure will determine whether the incretin franchise is sustaining its growth trajectory or beginning to decelerate. Consensus expects $6.65B for Mounjaro and $3.90B for Zepbound, totaling $10.55B. A result above $10.8B would indicate that supply improvements are translating to market share gains and that the CVS formulary exclusion has not materially impacted overall volume. A shortfall below $10.3B would raise questions about whether competitive dynamics are shifting or whether payer pushback is intensifying beyond the CVS situation.
The 2026 revenue growth guidance will set the framework for the next 12 months of estimate revisions. Current consensus of $77.56B implies 21.5% growth, which is achievable if incretin volume continues to scale and international expansion progresses. Guidance below $76B (20% growth) would likely trigger a multiple compression, as it would suggest the growth curve is inflecting downward faster than the Street models. Guidance above $80B (25% growth) would support a re-rating, as it would validate the bull thesis that Lilly’s incretin franchise has multi-year runway at elevated growth rates.
Performance margin commentary will determine whether the market views incretin growth as high-quality earnings expansion or revenue growth that gets offset by margin compression. Management’s Q3 guide of 45-46% non-GAAP performance margin provided a framework that exceeded prior Street assumptions. Maintaining or expanding that range in 2026 guidance would support the thesis that Lilly can defend pricing despite payer pressure. A guide below 44% would raise concerns that gross-to-net realization is deteriorating or that promotional spending is escalating to defend share against Novo.
Orforglipron regulatory and launch timing will shape the competitive narrative. Lilly filed regulatory applications in December 2025, setting up potential approval in 2026. Clear commentary on approval timing, commercial launch plans, and positioning relative to Novo’s oral Wegovy would provide confidence that Lilly can compete effectively in the oral GLP-1 market. Vague or delayed timeline commentary would undermine the thesis that Lilly maintains competitive parity, as Novo would extend its first-mover advantage.
Formulary access updates, particularly around the CVS Caremark exclusion, will signal whether the Q3 prescription decline was an isolated event or the beginning of broader payer pushback. Resolution of the CVS issue or commentary indicating no further exclusions would remove a key overhang. Expansion of exclusions to other major payers or lack of progress on CVS would raise structural market access concerns and likely drive estimate cuts for Zepbound specifically.
Searching for the Perfect Broker?
Supplement your charting with a free trading platform that rivals the best out there – multiple charts on one screen for easy monitoring, ProRealTime provides the perfect support for your investing or trading journey.
Discover our top-recommended brokers for trading stocks, forex, cryptos, and beyond. Dive in and test their capabilities with complimentary demo accounts today!
- IG Top-tier regulation – Read our Review
- eToro Wide range of instruments available to trade – Read our Review
YOUR CAPITAL IS AT RISK. 76% OF RETAIL CFD ACCOUNTS LOSE MONEY

