Ferrari reports fourth quarter and full year 2025 results on February 10 before market open, providing the first complete read on the company’s most significant model transition in recent years.
With the Daytona phase-out creating volume headwinds that the F80 supercar ramp cannot yet offset, consensus sits at $2.04 EPS and $1.71B revenue, both slightly below management’s full-year floors. The setup creates asymmetric risk: if Ferrari merely meets its own conservative floors without signaling upside to 2026 or the Elettrica launch timeline, the stock’s 29.7% decline over the past year may not find a floor.
$59.63B
31.6
$2.04
$1.71B
The quarter matters less for the reported numbers than for what management signals about the path forward. Ferrari has delivered 19 consecutive quarterly beats, but Q2 2025 demonstrated that execution alone no longer satisfies investors positioned for a higher growth trajectory. The October Capital Markets Day reset expectations downward with a 2030 revenue target of €9B implying roughly 5% CAGR, triggering a sharp selloff despite near-term guidance raises.
 WELCOME BONUS - Free Share Bundle When You Invest £50!
Get up to £500 cashback for investing with IG.
WELCOME BONUS - Free Share Bundle When You Invest £50!
Get up to £500 cashback for investing with IG.
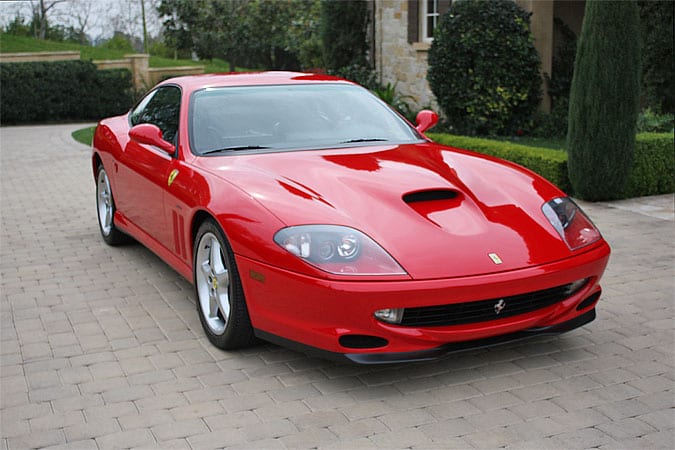
Ferrari’s iconic design and luxury positioning face a critical test as the company navigates its most significant product transition in recent years with the F80 launch and upcoming Elettrica debut.
The valuation debate hinges on whether Ferrari’s scarcity-driven model can sustain margin expansion through personalization and mix even as it navigates EV transition costs. The stock trades at 31.6x trailing earnings after multiple compression, down from 52-week highs near $519 but still commanding a premium to luxury peers.
[auto_nav]
Consensus Estimates
| Metric | Consensus Est. | Range | Prior Guidance | YoY Change |
|---|---|---|---|---|
| EPS (Adjusted) | $2.04 | $2.02 – $2.06 | €8.80+ (FY25) | -1.8% |
| Revenue | $1.71B | $1.69B – $1.73B | €7.1B+ (FY25) | +4.0% |
| Full Year EPS | $8.95 | $8.81 – $9.27 | €8.80+ | +7.5% |
| Full Year Revenue | $7.12B | N/A | €7.1B+ | +6.8% |
Analysts Covering: 3 (EPS) / 7 (Revenue)
Estimate Revisions (30d): 1 up / 0 down
Consensus for Q4 sits marginally below the midpoint implied by Ferrari’s full-year floors, reflecting analyst caution around the timing and magnitude of the Daytona-to-F80 transition. The $2.04 EPS estimate represents a 1.8% decline year-over-year, the first quarterly EPS contraction in the dataset, driven by elevated depreciation from new model launches and increased racing expenditures.
The estimate range is tight, with EPS spanning just $0.04 from low to high, suggesting limited disagreement on the mechanical impact of the model transition. The more binding benchmark is Ferrari’s own full-year guidance of €8.80+ adjusted diluted EPS and €7.1B+ revenue.
Management Guidance & Commentary
“We are targeting new heights with net revenues of at least €9 billion in 2030, supported by a disciplined approach to volumes and a continued focus on exclusivity and personalization.”
Ferrari’s October 9, 2025 Capital Markets Day established the current guidance framework, raising full-year 2025 floors to €8.80+ adjusted diluted EPS and €7.1B+ revenue while simultaneously introducing 2030 targets that disappointed growth-oriented investors. The 2030 revenue target of €9B implies roughly 5% CAGR from 2025 levels, a measured trajectory that prioritizes margin expansion and brand preservation over volume acceleration.
“The launch of Ferrari Elettrica in spring 2026 represents a pivotal moment for the brand, and we are approaching it with the same discipline and attention to detail that defines everything we do.”
The Elettrica launch timeline creates a near-term catalyst that could validate or challenge management’s conservative posture. The company has signaled spring 2026 deliveries, positioning the electric model as a complement to rather than replacement for the ICE and hybrid lineup.
Analyst Price Targets & Ratings
Wall Street maintains a bullish stance with 80% of analysts rating shares a Buy or Strong Buy. The consensus target of $450.62 implies 33.5% upside from current levels, suggesting analysts believe the market has overreacted to conservative 2030 guidance.
Sector & Peer Comparison
| Company | Ticker | Market Cap | P/E | Fwd P/E | Profit Margin |
|---|---|---|---|---|---|
|
Ferrari NV
⭐ Focus |
RACE | $59.63B | 31.6 | 28.2 | 22.6% |
|
LVMH Moët Hennessy
|
LVMUY | $338.2B | 22.8 | 20.1 | 21.1% |
|
Hermès International
|
HESAY | $242.8B | 48.2 | 42.1 | 34.2% |
|
Porsche AG
|
POAHY | $54.1B | 8.4 | 7.9 | 15.8% |
|
BMW AG
|
BMWYY | $52.3B | 4.2 | 4.8 | 7.9% |
Ferrari trades at a 31.6x P/E multiple, positioning it between traditional luxury goods companies and premium automotive manufacturers. The valuation sits well above German luxury automakers but below pure luxury brands like Hermès (48.2x), reflecting Ferrari’s unique hybrid positioning.
Earnings Track Record
| Quarter | EPS Actual | EPS Est. | Result | Surprise % |
|---|---|---|---|---|
| Q3 2025 | $2.14 | $2.04 | Beat | +4.9% |
| Q2 2025 | $2.38 | $2.31 | Beat | +3.0% |
| Q1 2025 | $2.30 | $2.25 | Beat | +2.2% |
| Q4 2024 | $2.14 | $1.82 | Beat | +17.6% |
| Q3 2024 | $2.08 | $2.00 | Beat | +4.0% |
Ferrari has delivered 19 consecutive quarterly beats with a 100% success rate, establishing a pattern of consistent execution. The 8.5% average surprise demonstrates that Ferrari’s beats come from execution rather than sandbagging, though recent quarters show smaller beats as analysts have learned to model the company’s dynamics more accurately.

Ferrari’s track record of 19 consecutive quarterly beats reflects operational excellence, but investors now demand forward guidance that validates the company’s premium valuation through the EV transition.
Post-Earnings Price Movement History
| Date | Surprise | EPS vs Est. | Next Day Move | Price Change |
|---|---|---|---|---|
| Q3 2025 | +4.9% | $2.14 vs $2.04 | +1.7% | $482.04 to $490.24 |
| Q2 2025 | +3.0% | $2.38 vs $2.31 | -0.4% | $491.10 to $489.37 |
| Q1 2025 | +2.2% | $2.30 vs $2.25 | +0.2% | $429.71 to $430.61 |
| Q4 2024 | +17.6% | $2.14 vs $1.82 | -2.4% | $426.77 to $416.42 |
Ferrari’s post-earnings price action shows minimal correlation between beat magnitude and stock performance, with an average move of -0.7% despite perfect execution. The pattern reveals that guidance and forward commentary drive reactions more than reported results, as demonstrated by Q4 2024’s 17.6% beat followed by a 2.4% decline.
Expected Move & Implied Volatility
28.3%
62%
24.1%
The options market prices a 4.2% move in either direction, above the historical average post-earnings reaction of -0.7%. The 28.3% implied volatility at the 62nd percentile suggests elevated uncertainty around the model transition and potential guidance changes.
Expert Predictions & What to Watch
Key Outlook: Guidance Will Drive the Trade
Key Metrics to Watch
Ferrari’s February 10 earnings will test whether the company’s scarcity-driven model can sustain premium margins through the most significant product transition in recent years, with F80 production ramp and Elettrica launch timing critical for 2026 outlook.
The February 10 call will test whether Ferrari can thread the needle, delivering results that validate execution while providing enough forward visibility to support a valuation re-rating. With consensus already pricing in conservative performance, the guidance tone and 2026 outlook commentary will likely drive the stock’s reaction more than Q4 numbers themselves. For investors considering trading vs investing in Ferrari, the earnings call will provide critical insights into the company’s long-term growth trajectory. Those looking to understand what is leverage in trading should consider the amplified risks and rewards when taking positions around earnings announcements.
Searching for the Perfect Broker?
Supplement your charting with a free trading platform that rivals the best out there – multiple charts on one screen for easy monitoring, ProRealTime provides the perfect support for your investing or trading journey.
Discover our top-recommended brokers for trading stocks, forex, cryptos, and beyond. Dive in and test their capabilities with complimentary demo accounts today!
- IG Top-tier regulation – Read our Review
- eToro Wide range of instruments available to trade – Read our Review
YOUR CAPITAL IS AT RISK. 76% OF RETAIL CFD ACCOUNTS LOSE MONEY

