
- Currency markets are seeing significant flows of capital into safe havens.
- The retreat from Asian markets follows continuing uncertainty over the coronavirus, Covid-19 outbreak.
- Even short-term ‘panic’ measures ultimately come back in line with technical and fundamental analysis.
- On a short-term basis, the US dollar looks overbought and euro over-sold and there are plenty of potential trigger points on the horizon, which might act as a catalyst of the next price move.
In terms of global capital flows, the notable trend of the last month has been increasing demand for the US dollar. The Dixie (USDX) index of the dollar, as measured against a basket of global currencies, has broken out of a long-term downtrend, which had held firm through Q4 of 2019.
 WELCOME BONUS - Free Share Bundle When You Invest £50!
Open a UK Investment Account: Shares, ISAs, Managed Portfolio
Invest in 15,000+ shares and ETFs. Open an account now, invest at least £50, and you’ll get a free share bundle worth between £40 and £200. T&Cs apply.
IG
View Offers
WELCOME BONUS - Free Share Bundle When You Invest £50!
Open a UK Investment Account: Shares, ISAs, Managed Portfolio
Invest in 15,000+ shares and ETFs. Open an account now, invest at least £50, and you’ll get a free share bundle worth between £40 and £200. T&Cs apply.
IG
View Offers
Dixie
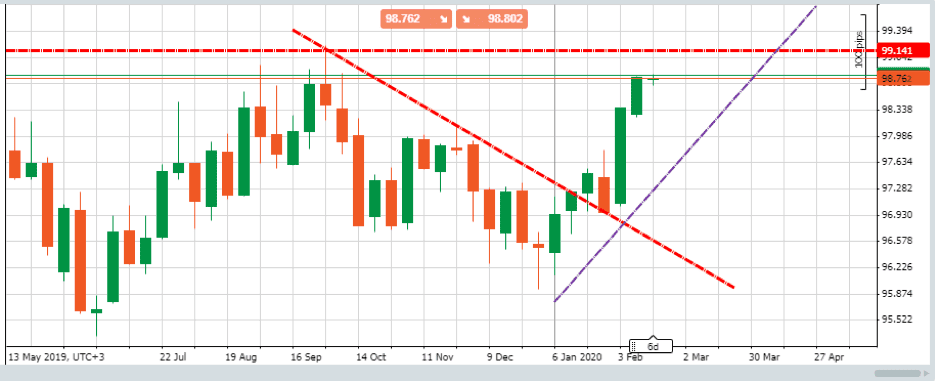
Dollar index — USDX — weekly candles — 13th May 2019–17th Feb 2020:
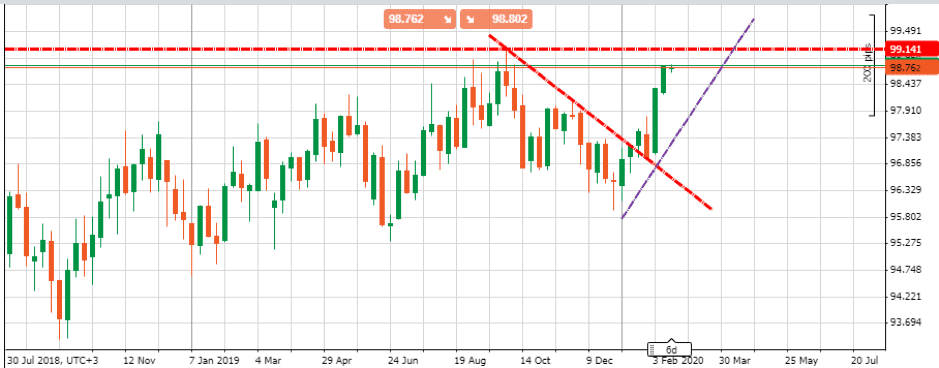
Dollar index — USDX — weekly candles – July 2018–17th Feb 2020:
Dollar index — USDX — weekly candles — December 2016–17th February 2020:
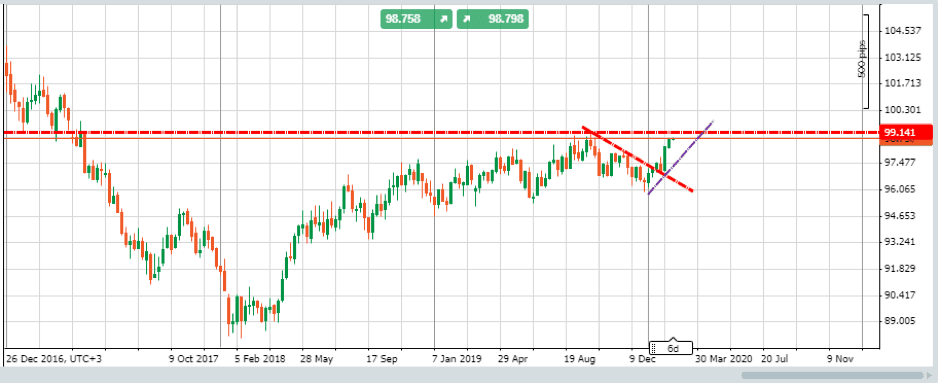
The long-term chart dating back to 2016 shows current price nearing a four-year high. This price action points to further upwards movement — with the potential to meet resistance at this multi-year high, which is in the region of 99.141. Any further upward movement would then involve breaking the psychologically important ‘big number’ of 100. Five of the last six weekly candles are green and demonstrate just how momentum has built. All trends have a bend in the end, which supports the suggestion that USDX may, momentarily, be running out of steam.
Recent price action displayed waning momentum as the markets finished up last week’s trading.
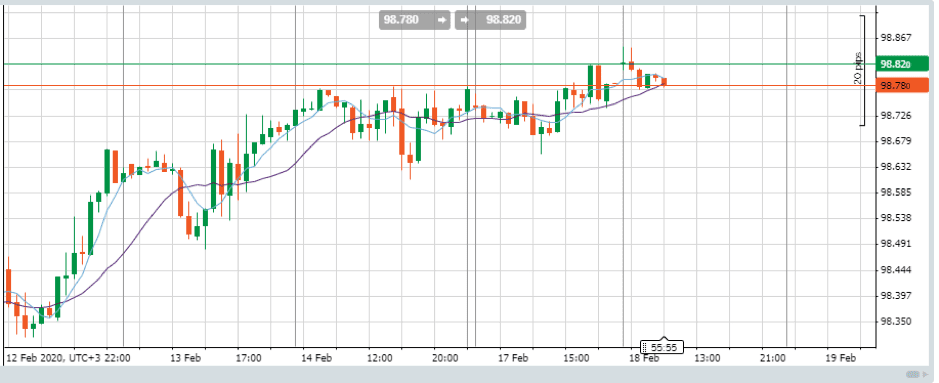
Dollar index — USDX — hourly candles — 11th February–18th February 2020:
This could, of course, represent price consolidation before further upward movement. Moves in other assets, notably US Treasuries, point to traders taking some risk off the table during Thursday and Friday.
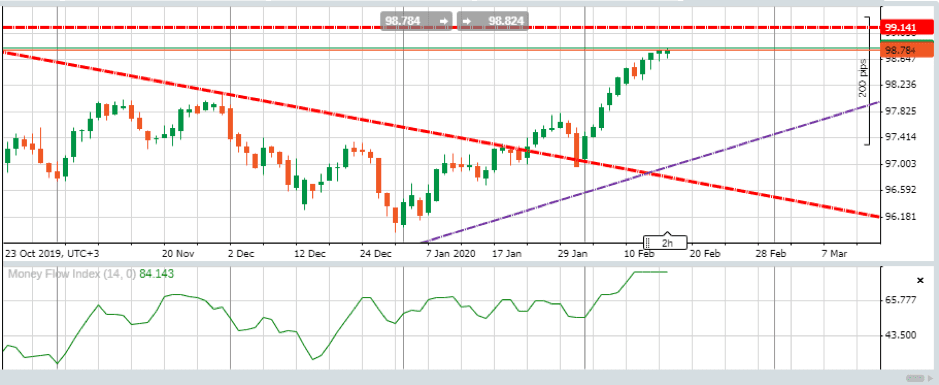
The introduction of the Money Flow Index (MFI) momentum indicator introduces the element of trading volumes into the equation. Using daily candles, the MFI is at a several-month high in terms of being overbought.
Dollar index — USDX — daily candles and MFI — October 2019–17th February 2020:
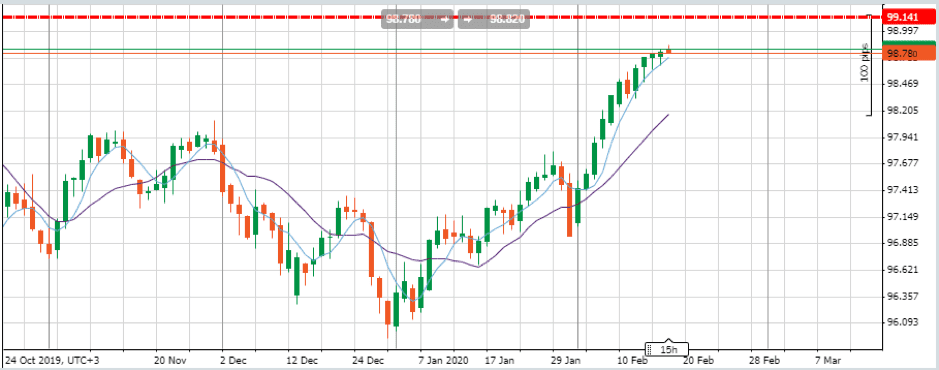
Those monitoring the situation and looking for a reversal will note that the five-day SMA appears to be a good test of support. On the daily chart, price has closed above this line in every daily session since the initial break-out in January.
Dollar index — USDX — daily candles and SMI — October 2019–18th February 2020:
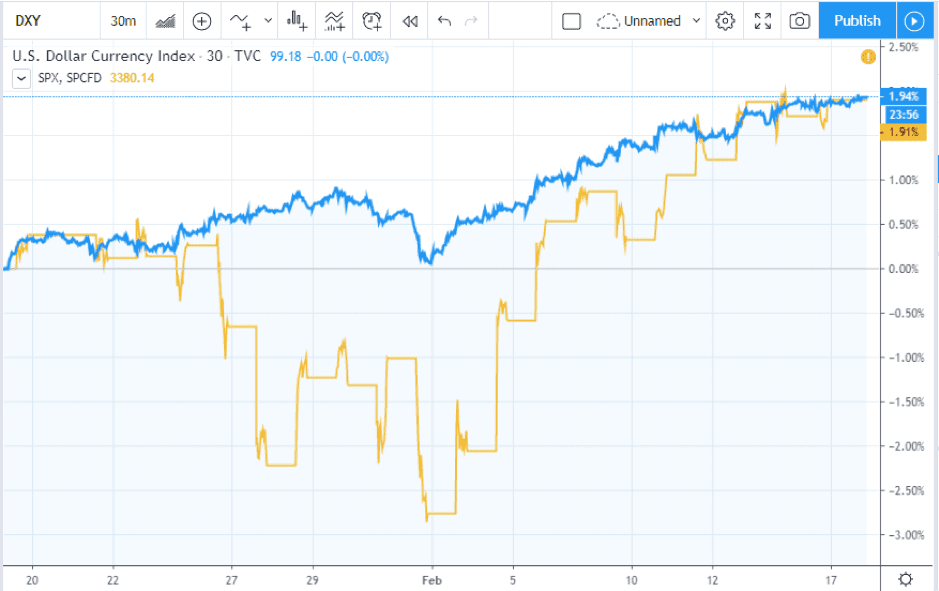
There are signs of a pullback in the broad dollar market over the coming week. This would have a knock-on effect on other US assets, especially ‘risk-on’ equities, which have been a major beneficiary of the shift to USD. The one-month price chart for the S&P500 share index mirrors that of the USDX as global funds shift into American assets. The S&P faces greater downward pressure at times of peak concern about the coronavirus outbreak. It started and finished the last trading month in almost an identical position to the USDX.
USDX vs S&P500 — one-month price chart:
The hourly chart for S&P500 futures shows the index making a tentative start to the week. It can be expected that the US president’s day holiday on 17th February would play a part in the index forming a somewhat directionless price pattern.
S&P500 (US500) index — hourly candles — 12th February–18th February 2020:
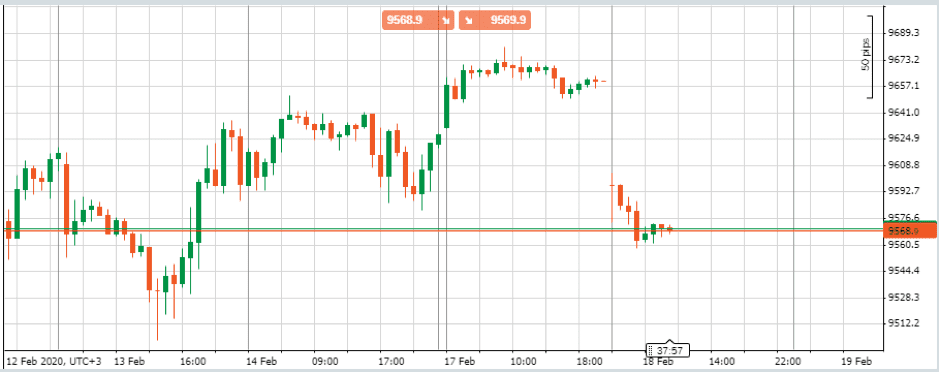
With several Asian markets, in particular, the Nikkei225 experiencing minor sell-offs on Monday and Tuesday, the relationship between USDX and US equity indices could be tested through the rest of the week. The Nasdaq futures index (NAS100) was printing week-to-date lows in the region of 9,570 at the time of Asian markets closing on Tuesday.
Nasdaq (NAS100) index — hourly candles — 12th February–18th February 2020:
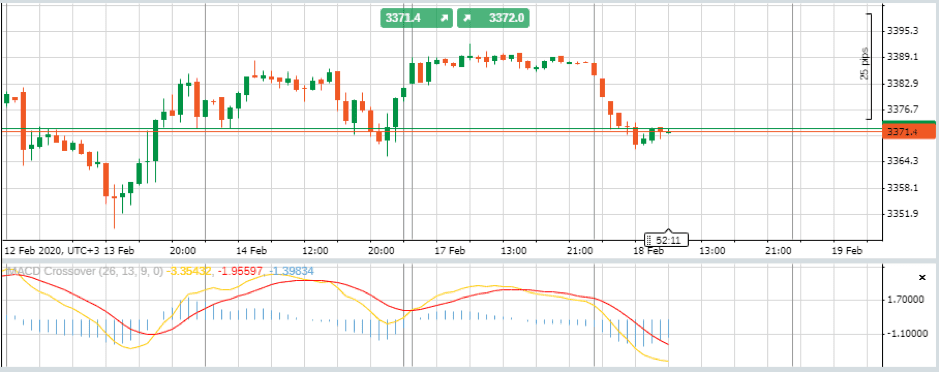
EURUSD
While USDX monitors the dollar’s progress against a broad range of other currencies, analysis of EURUSD shows the underlying trends that form the aggregated move. The situation is nuanced by the euro experiencing long-term weakness. There may be few taking a position on that situation changing in the immediate future. However, there are indicators to analyse and monitor, which may be useful for spotting when that particular trend might come to an end.
The EURUSD forex pair matches a weakening dollar against a euro currency — the latter reflects continued weakness the eurozone economies. Data on G7 countries and the year-on-year GDP growth in Q4 (2018 to 2019) shows a gap between the US and eurozone economies of 1.4 percentage points.
Increase in GDP Q4 2019 with Q4 2018
US +2.3%
Canada +1.7% (Q3)
UK +1.1%
Eurozone +0.9%
France +0.8%
Germany +0.4%
Italy 0.0%
Japan -0.4%
The German central bank, Bundesbank, released its monthly report on Monday and reported that economic growth would likely remain weak in the first quarter of 2020. Downward pressure on the euro stems from these weak fundamentals, which many think will lead to even looser monetary policy from the European Central Bank (ECB).
EURUSD — four-hourly candles 29th January–18th February 2020:
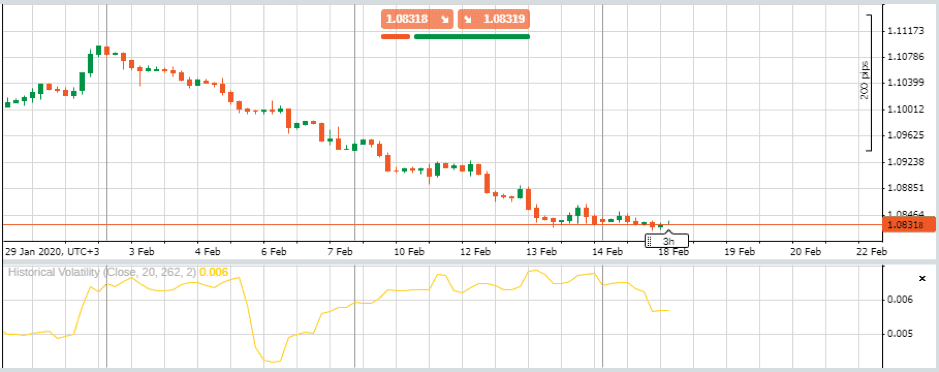
The coronavirus outbreak in China provides some respite for the euro due to it being, to some degree, a safe-haven currency — at least on from a global perspective. A short-term influx into euro matches increased concern about the virus outbreak and is seeing the gradient of the EURUSD price move flatten out. Not only is price beginning to trade sideways but (historical) volatility is also dropping.
Junichi Ishikawa, senior foreign exchange strategist at IG Securities in Tokyo, commented on how supply and demand may be temporarily balancing each other out. Speaking with, Reuters they said.
“The euro is close to testing an important support level at $1.08 due to the diverging economic outlook between the euro zone and the United States… It looks a little oversold, so in the very short-term there could be a bounce, but the euro’s fundamentals still point more to the downside.”
Source: Reuters
While continued euro weakness can’t be taken for granted, a reversal at the 1.083 level is being made all the more fragile by stop losses placed just below current price levels, which marks a three-year low. The effective and possibly prudent, risk management by the bottom-fishers leaves space for the dollar to hold its ground against the euro. Resistance to any euro recovery is considerable with daily SMAs providing barriers from 1.0984 all the way to 1.1113.
EURUSD Simple Moving Averages:Daily SMA20 – 1.0984
Daily SMA50 – 1.1075
Daily SMA100 – 1.1065
Daily SMA200 – 1.1113
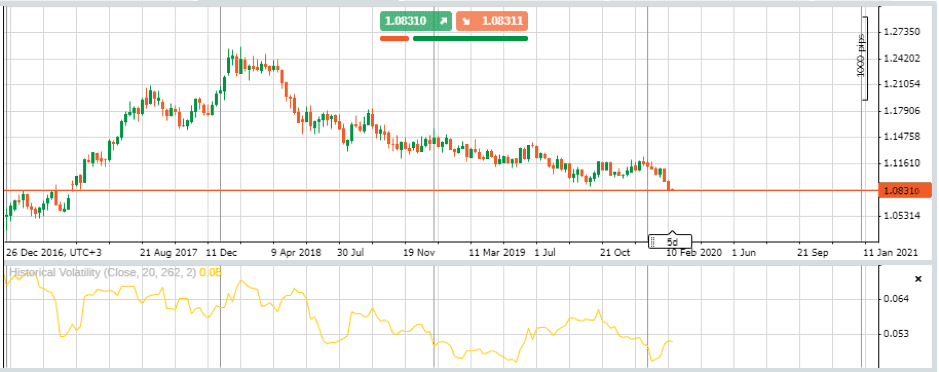
EURUSD — weekly candles — December 2016–18th February 2020:
ZEW
However, there are a number of factors that may come in to play in the next few days and trigger something of a reversal.
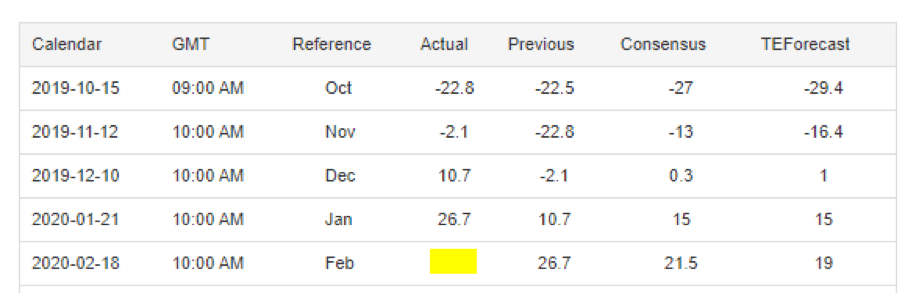
German sentiment data is due out on Tuesday. The previous reading of the ZEW Indicator of Economic Sentiment for Germany surpassed expectations and climbed 16.0 points on a month-on-month basis. The ‘actual’ figure of 26.7 comes in well above analyst forecasts of 15.0. The 26.7 data point was an impressive five-year high, but possibly of more interest for short-term traders is the volatility generated by such a mismatch between forecast and actual readings. If price is going to turn, then a shock-event such as a surprise in the ZEW data could be the required catalyst.
Germany Zew Economic Sentiment Index — table:
Germany Zew Economic Sentiment Index — 1Y Chart:

Technicals — daily pivot
With the US markets re-opening after a long weekend, some latent tension may be released and reflected in price volatility. Signs of short-term euro strength have already brought the 1.0839 pivot into play with EURUSD trading at 1.0836 in the 30-minute period prior to European exchanges opening.
DailyFX Pivot Points:
P 1.0839
S3 1.0795
S2 1.0817
S1 1.0826
R1 1.0848
R2 1.0861
R3 1.0883
Source: Daily FX
Price action near the pivot point is always monitored closely and sustained trading at levels higher than the daily pivot could lead the euro-bears to consider taking profits.
ECB calendar
Euro strength against the dollar would come as a surprise due to the length of time the downward channel has been in place. Those looking for a trigger for that change in direction can point to an unlikely source, the ECB. Conveniently, these events are set by a fixed calendar, so they at least offer traders the opportunity to prepare.
In terms of timing trade entry and exit points, the Governing Council of the ECB meets in Frankfurt on 19th February to hold its Non-monetary Policy Meeting. It will be an opportunity for the ECB to offer further guidance, which will be closely scrutinised. As there are no further meetings scheduled until 12th March, the ECB may well take the opportunity to put its point across and this opens the door to surprises.
New president Christine Lagarde was, and largely still is, seen as being from the same mould as her predecessor Mario Draghi. The new head inherited a landscape that includes negative base rates and a Q4 2019 resumption in quantitative easing, which is open-ended and pumping EUR 20bn per month into the markets. Weak fundamentals mean the ECB may not currently be in a position to take a hawkish stance, but there are signs that the ‘more of the same’ approach may not be completely accurate.
The minutes from the first ECB rates policy meeting of 2020 are due to be released on 20th February and may highlight a wait-and-see approach towards monetary policy. Lagarde appears to be in no rush to implement more non-standard measures and is accepting of the fact that further cuts to the main refinancing rate may not be effective. With EURUSD prices currently factoring in some chance of looser policy, even an absence of dovish commentary may trigger euro strength.
Fiscal policy
In terms of the trading outlook, the potential for Germany and the Netherlands to implement their fiscal spending represents somewhat of a wildcard element. The ECB and member states are some way into a war of attrition as the bank looks to Berlin and Amsterdam to spend their way out of trouble. On Tuesday, Reuters released a statement attributed to European finance ministers:
“If downside risks were to materialize, fiscal responses should be differentiated, aiming for a more supportive stance at the aggregate level.”
Source: Reuters
There is a shared understanding of the risks facing the eurozone. The chairman of eurozone finance ministers, Mario Centeno, told a news conference:
“While some… risks (to growth) have receded slightly, including in the case of Brexit and trade tensions, the recent outbreak of coronavirus is a reason for concern and one which we will need to monitor closely.”
Source: Reuters
Should Germany concede ground, then the euro would benefit from both increased GDP growth and reduced likelihood of the need for more ECB intervention.
The volatility and trade volume metrics could make for interesting reading as each range of potential triggers come into play. Price moves would have to be confirmed by a pick-up in either of those two if any new direction is to be sustained. Ishikawa’s analysis accurately points to EURUSD being oversold in the short term, while on the other hand, the eurozone economy is in long-term distress.