Rocket Lab reports Q4 2025 results on February 26 after market close. The quarter will determine whether the company can sustain the margin inflection delivered in Q3 while addressing the Neutron timeline reset following January’s Stage 1 tank rupture. Consensus sits at $151.72M revenue versus management’s $170M–$180M guidance midpoint of $175M, creating a material gap that reflects either conservative Street modeling or heightened execution skepticism after the testing setback.
The setup carries asymmetric risk tied to Neutron credibility rather than near-term financial performance. Rocket Lab guided Q4 revenue 15% above consensus and delivered four consecutive quarters of revenue beats, yet the stock has declined 30% from its 52-week high of $99.58. The repricing reflects investor concern that the tank rupture could delay Neutron’s maiden flight beyond 2026, undermining the medium-lift market thesis that underpins the company’s $37.5B valuation despite ongoing GAAP losses. Management’s updated Neutron timeline will carry more weight than Q4 results in determining whether the stock can reclaim its premium multiple.
$37.50B
N/A
-$0.10
$151.72M
The quarter also tests whether Q3’s operating leverage was an inflection or an outlier. Rocket Lab posted a -$0.03 GAAP loss in Q3 versus -$0.11 expected, the first material evidence that revenue scale could translate into narrowing losses ahead of Neutron commercialization. The company guided Q4 GAAP gross margins to 37%–39%, sustaining the higher profile established in Q3. A return to wider losses or margin compression would validate bear concerns that the cost base remains too heavy relative to current revenue, particularly if Neutron delays extend the investment cycle.
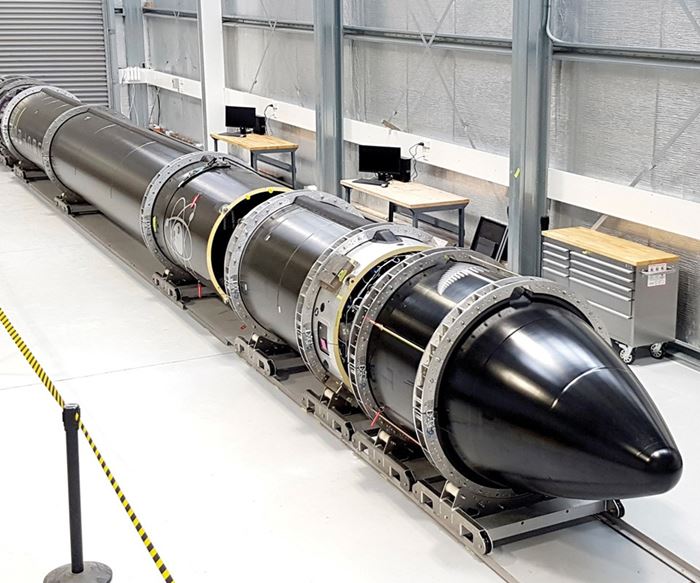
Rocket Lab’s Electron rocket in the company’s manufacturing facility, showcasing the integrated launch platform that has delivered consistent revenue growth
Consensus Estimates
| Metric | Consensus Est. | Range | Prior Guidance | YoY Change |
|---|---|---|---|---|
| EPS (GAAP) | -$0.10 | -$0.12 to -$0.09 | Not provided | +4.5% |
| Revenue | $151.72M | $143.00M – $171.43M | $170M – $180M | +44.8% |
| Gross Margin (GAAP) | 38.0% | 37.0% – 39.0% | 37% – 39% | +150 bps |
Analysts Covering: 9 (EPS) / 13 (Revenue)
Estimate Revisions (30d): 1 up / 0 down
Consensus revenue of $151.72M sits 13% below management’s guidance midpoint of $175M, the widest gap in the past year. The disconnect suggests the Street is either modeling conservatively around execution risk or discounting the high end of guidance following the Neutron testing incident. Revenue estimates have remained essentially flat over the past 30 days despite one upward revision, indicating analysts are waiting for the earnings call to adjust models rather than front-running guidance.
The EPS estimate of -$0.10 matches the year-ago result, implying the Street expects no year-over-year improvement in the loss profile despite 45% revenue growth. This conservative posture reflects uncertainty about whether the Q3 margin inflection can persist or whether elevated R&D and Neutron-related costs will re-widen losses. The estimate range of -$0.12 to -$0.09 is narrow, suggesting limited conviction in either direction until management clarifies the cost trajectory alongside the Neutron timeline update.
Management Guidance and Commentary
“We expect Q4 2025 revenue between $170 million and $180 million. GAAP gross margins are expected to be between 37% and 39%.”
Management’s Q4 guidance, issued during the November 10 Q3 earnings call, established a revenue midpoint of $175M and sustained the higher gross margin profile that emerged in Q3. The guidance represented sequential revenue growth of 13% from Q3’s $155.1M and implied continued momentum in both launch services and the Space Systems segment. The company framed the margin guidance as evidence of operating leverage beginning to materialize even before Neutron commercialization, a critical narrative shift after three consecutive quarters of widening losses despite revenue beats.
The January disclosure of the Neutron Stage 1 tank rupture during hydrostatic pressure qualification testing altered the forward-looking setup without changing Q4 guidance. Management emphasized that such outcomes are common during development testing for medium-lift vehicles but promised an updated Neutron timeline during the Q4 call. The statement created a binary outcome for investor confidence: a delay measured in quarters would likely be absorbed given the company’s $1.1B backlog and strong core business momentum, while a delay extending into 2027 would undermine the medium-lift market thesis and pressure the valuation multiple.
The gap between the $175M guidance midpoint and $151.72M consensus reflects either conservative Street modeling or skepticism that the company can deliver the high end of the range while managing Neutron development costs. Historical patterns show Rocket Lab has beaten revenue guidance in recent quarters, suggesting the midpoint may prove achievable. The margin guidance of 37%–39% GAAP gross margin carries more analytical weight than the revenue figure, as sustained margin expansion would validate that the Q3 inflection was structural rather than mix-driven.
Analyst Price Targets & Ratings
Wall Street maintains a constructive view with 81% of analysts rating shares a Buy or Strong Buy. The consensus target of $83.96 implies nearly 20% upside from current levels, though this reflects pre-Neutron delay assumptions. Recent price target adjustments have been modest, suggesting analysts are waiting for the Q4 call to reassess timelines rather than making material changes based on the tank rupture disclosure alone.
Sector & Peer Comparison
| Company | Ticker | Market Cap | P/E | Fwd P/E | Profit Margin |
|---|---|---|---|---|---|
|
Rocket Lab USA Inc.
⭐ Focus |
RKLB | $37.50B | N/A | N/A | -35.6% |
|
Lockheed Martin Corp.
|
LMT | $122.8B | 18.2 | 16.8 | 7.1% |
|
Northrop Grumman Corp.
|
NOC | $68.4B | 15.9 | 14.2 | 8.3% |
|
L3Harris Technologies Inc.
|
LHX | $42.1B | 21.4 | 17.6 | 9.2% |
|
Boeing Co.
|
BA | $98.3B | N/A | N/A | -8.4% |
|
Virgin Galactic Holdings Inc.
|
SPCE | $1.2B | N/A | N/A | -412.8% |
Rocket Lab trades at a $37.5B market capitalization despite negative profitability, positioning it between established defense primes and speculative space ventures. The valuation reflects the market’s willingness to pay for growth and strategic positioning in the commercial space sector rather than current earnings power. Traditional aerospace peers such as Lockheed Martin and Northrop Grumman trade at mid-teens forward P/E multiples with high-single-digit profit margins, highlighting the premium embedded in Rocket Lab’s growth narrative.
The company’s -35.6% profit margin compares favorably to Virgin Galactic’s -412.8% but underscores that Rocket Lab remains in the investment phase of its business model. The key differentiation versus other unprofitable space companies is revenue scale and trajectory: Rocket Lab generated $155M in Q3 2025 with 48% year-over-year growth, while maintaining a path to profitability through operating leverage rather than requiring a step-function change in the business model. The $37.5B valuation implies the market is pricing in successful Neutron commercialization and sustained share gains in both launch services and space systems, creating vulnerability to execution delays or competitive pressure.

Computer rendering of Rocket Lab’s Neutron rocket, the medium-lift vehicle targeting the market currently dominated by SpaceX’s Falcon 9
Earnings Track Record
| Quarter | EPS Actual | EPS Est. | Result | Surprise % |
|---|---|---|---|---|
| Q3 2025 | -$0.03 | -$0.07 | Beat | +56.0% |
| Q2 2025 | -$0.13 | -$0.09 | Miss | -44.4% |
| Q1 2025 | -$0.07 | -$0.09 | Beat | +17.8% |
| Q4 2024 | -$0.10 | -$0.09 | Miss | -11.1% |
| Q3 2024 | -$0.10 | -$0.09 | Miss | -11.1% |
| Q2 2024 | -$0.08 | -$0.10 | Beat | +20.0% |
| Q1 2024 | -$0.09 | -$0.11 | Beat | +18.2% |
| Q4 2023 | -$0.10 | -$0.10 | Met | 0.0% |
Rocket Lab’s 47.1% beat rate over the past 20 quarters masks a pattern where revenue consistently exceeds expectations while EPS results oscillate based on investment intensity. The company beat EPS estimates in five of the past eight quarters, but three of those beats came in early 2024 and late 2023 when losses were stabilizing in the -$0.08 to -$0.10 range. The Q2 2025 miss of -$0.13 versus -$0.09 expected reflected elevated R&D and Neutron-related costs, while the Q3 2025 beat of -$0.03 versus -$0.11 expected marked the first quarter where operating leverage materially improved the loss profile.
The average surprise of +10.7% is skewed by the magnitude of the Q3 2025 beat, which delivered a 56% positive surprise. Excluding that outlier, the average surprise drops to approximately +5%, indicating the company typically lands close to consensus on the bottom line. The track record suggests revenue guidance is conservative and typically exceeded, while EPS outcomes depend heavily on the timing of development spending and whether the company chooses to accelerate or moderate investment in a given quarter.
Post-Earnings Price Movement History
| Date | Result | EPS vs Est. | Next Day Move | Price Change |
|---|---|---|---|---|
| Q3 2025 | +56.0% | -$0.03 vs -$0.07 | +2.0% | $47.01 to $47.97 |
| Q2 2025 | -44.4% | -$0.13 vs -$0.09 | -3.0% | $35.38 to $34.33 |
| Q1 2025 | +17.8% | -$0.07 vs -$0.09 | -2.5% | $18.62 to $18.15 |
| Q4 2024 | -11.1% | -$0.10 vs -$0.09 | -5.2% | $26.32 to $24.96 |
| Q3 2024 | -11.1% | -$0.10 vs -$0.09 | -5.6% | $9.78 to $9.23 |
The average next-day move of -2.8% reflects a pattern where guidance and forward commentary drive price action more than reported results. Beats on EPS have generated an average move of only -0.2%, indicating the market discounts bottom-line surprises when they are not accompanied by constructive forward guidance or margin improvement. The Q1 2025 result illustrates this dynamic: the company beat EPS estimates by 17.8% yet the stock declined 2.5% the next day after management guided Q2 revenue below Street expectations at the time.
Misses have produced an average decline of -4.6%, with the magnitude depending on whether the miss reflects temporary cost timing or a structural deterioration in the business model. The Q4 2024 and Q3 2024 misses of -11.1% each triggered declines exceeding 5% because they coincided with concerns about Neutron development costs and the sustainability of the Space Systems growth rate. The Q3 2025 beat of 56% generated only a 2.0% gain, suggesting the market had already priced in improving operating leverage before the result.
The historical pattern suggests Q4 2025 price action will depend primarily on the Neutron timeline update rather than whether the company reports -$0.08 or -$0.12 EPS. A delay pushing the maiden flight into late 2026 or 2027 would likely trigger a decline exceeding the -4.6% average miss reaction, while a timeline confirming launch readiness in mid-2026 could support a positive move even if EPS misses consensus. The stock’s 30% decline from its 52-week high has partially de-risked the setup, but the $37.5B valuation still embeds significant Neutron execution premium.
Expected Move & Implied Volatility
72%
68%
65%
The options market is pricing an 8.5% move in either direction, materially above the -2.8% average historical next-day move. The elevated implied volatility of 72% versus 65% realized volatility over the past 30 days indicates options buyers are paying a premium for event protection, consistent with the binary setup around Neutron timeline clarity. The 68th percentile IV reading suggests the market views this earnings event as carrying above-average uncertainty relative to Rocket Lab’s typical quarterly results.
The $64.33 to $76.29 implied range brackets the current $70.31 price symmetrically, indicating options positioning does not favor a directional bias. The upper bound of $76.29 would represent a recovery of roughly one-third of the stock’s decline from its $99.58 high, achievable if management provides a constructive Neutron timeline and sustains Q4 margin guidance. The lower bound of $64.33 would mark a 9% decline from current levels, likely triggered by a Neutron delay extending into 2027 or Q4 results missing the low end of revenue guidance.
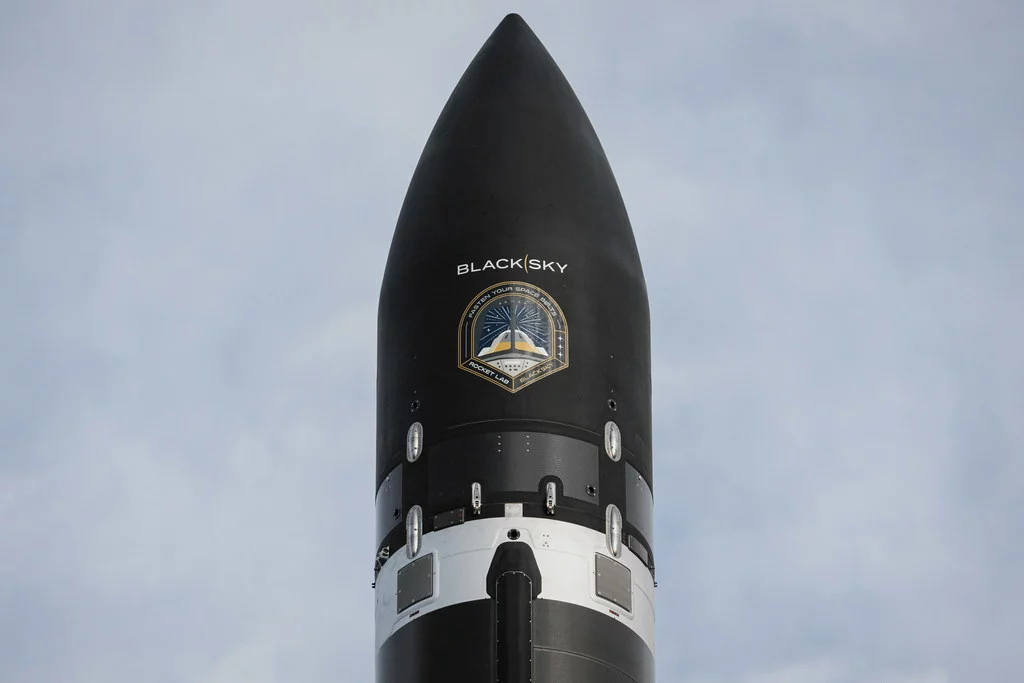
Rocket Lab’s Electron rocket featuring the BlackSky mission patch, demonstrating the company’s reliable small-lift launch services
Expert Predictions & What to Watch
Key Outlook: Cautiously Constructive
The base case assumes Rocket Lab reports Q4 revenue between $165M and $172M, above the $151.72M consensus but below management’s $175M midpoint. This outcome would extend the company’s revenue beat streak to five consecutive quarters while acknowledging that the high end of guidance may have been optimistic given the Neutron testing incident. GAAP gross margins are likely to land within the guided 37%–39% range, sustaining the Q3 inflection and validating that operating leverage is materializing even before Neutron commercialization.
The Neutron timeline update will determine whether the stock trades on the quarter’s financial performance or re-rates based on altered growth expectations. If management confirms the maiden flight remains on track for mid-2026 with minimal schedule impact from the tank rupture, the market will likely focus on the positive revenue trajectory and margin improvement, supporting a move toward the $80 level. Conversely, a delay pushing the first launch into late 2026 or 2027 would undermine the medium-lift market thesis and trigger a reassessment of the $37.5B valuation, potentially driving shares toward $60 as investors price in extended time to profitability.
Key Metrics to Watch
The Neutron timeline update will determine the stock’s immediate direction more than any financial metric. Investors should focus on whether management frames the delay in terms of quarters or years, and whether the tank rupture requires a fundamental redesign or simply design iteration. The difference between a mid-2026 maiden flight and a 2027 timeline represents a material change in the company’s competitive positioning and time to profitability, justifying the binary setup reflected in options pricing.
Revenue performance relative to the $175M guidance midpoint will provide the clearest read on execution and demand visibility. The company has beaten revenue guidance in recent quarters, making a miss particularly meaningful if it occurs. Gross margin sustainability at or above 38% is critical for validating that the Q3 inflection was structural, as margin compression would undermine the thesis that Rocket Lab can achieve profitability through operating leverage before Neutron commercialization.
Space Systems backlog and new bookings will signal whether the core business can sustain growth independent of Neutron timing. The segment’s $1.1B backlog at the end of Q3 provides revenue visibility into 2026, but expansion above $1.15B with new government contract wins would reinforce confidence in the near-term trajectory. Q1 2026 guidance will establish whether management expects sequential growth to continue or whether Q4 represents a near-term peak, with implications for full-year 2026 estimates and the path to profitability.
Searching for the Perfect Broker?
Supplement your charting with a free trading platform that rivals the best out there – multiple charts on one screen for easy monitoring, ProRealTime provides the perfect support for your investing or trading journey.
Discover our top-recommended brokers for trading stocks, forex, cryptos, and beyond. Dive in and test their capabilities with complimentary demo accounts today!
- eToro Wide range of instruments available to trade – Read our Review
- XTB UK regulated by the FCA – Read our Review
- BlackBull 26,000+ Shares, Options, ETFs, Bonds, and other underlying assets – Read our Review
YOUR CAPITAL IS AT RISK. 76% OF RETAIL CFD ACCOUNTS LOSE MONEY


