
Hammer candlestick patterns occur when the price of an asset falls to levels that are far below the opening price of the trading period before rallying back to recover some (or all) of those losses as the charting period completes. The Hammer chart pattern received its name because these formations have a club-shaped upper candle region and a long lower wick (giving each pattern an appearance that resembles a traditional hammer work tool). In most cases, the lower wick will be twice as long as the candle body and the closing price level determines whether its trading signals will be bullish or bearish.
- Hammer candlestick patterns generally occur after a major decline in prices, developing with an extended lower shadow and a small candle body near the top of the formation.
- Bullish Hammer patterns are more common and they require closing prices to move above the opening price of the trading period.
- Bearish Hammer patterns are less common and they require closing prices to remain below the opening price of the trading period.
- Hammer chart patterns will usually show a lower wick that is at least twice the length of the real candle body (indicating a strong price rejection near the lows of the period).
- Hammer candles indicate potential reversals in price and these chart patterns can be confirmed using technical indicators or breaks of important support/resistance levels.
How is a Hammer candlestick formation useful for traders? Bullish Hammer patterns often occur after asset prices have been declining and these formations suggest that the majority of the market is making an attempt to establish a bottom. For these reasons, market prices tend to see a forceful rejection from the lows of the period and this is the trading activity that ultimately forms the extended lower wick visible in the pattern.
Bearish Hammer formations can also develop and these events can be equally useful for traders attempting to make forecasts about future trend direction in the financial markets. In the graphic below, we can see the similarities that exist within the price structures of each Hammer candlestick pattern.
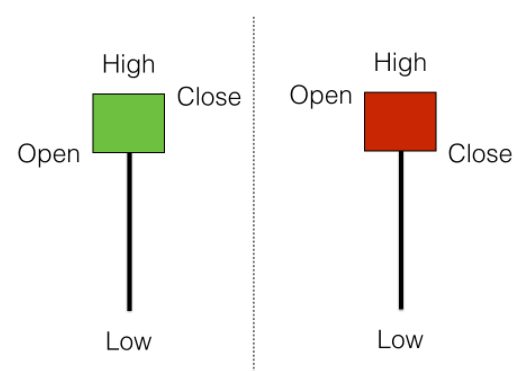
Essentially, traders are able to use this information to establish a trading stance. A Bullish Hammer pattern (green candle) supports the outlook for long positions while a bearish Hammer pattern (red candle) supports the outlook for short positions.
As an alternative variation on these themes, the structure of the Hammer pattern can also be turned upside down to form an Inverted Hammer. Ultimately, the same rules apply when trading an Inverted Hammer candle formation (only in reverse) because its structure implies a strong reversal signal.
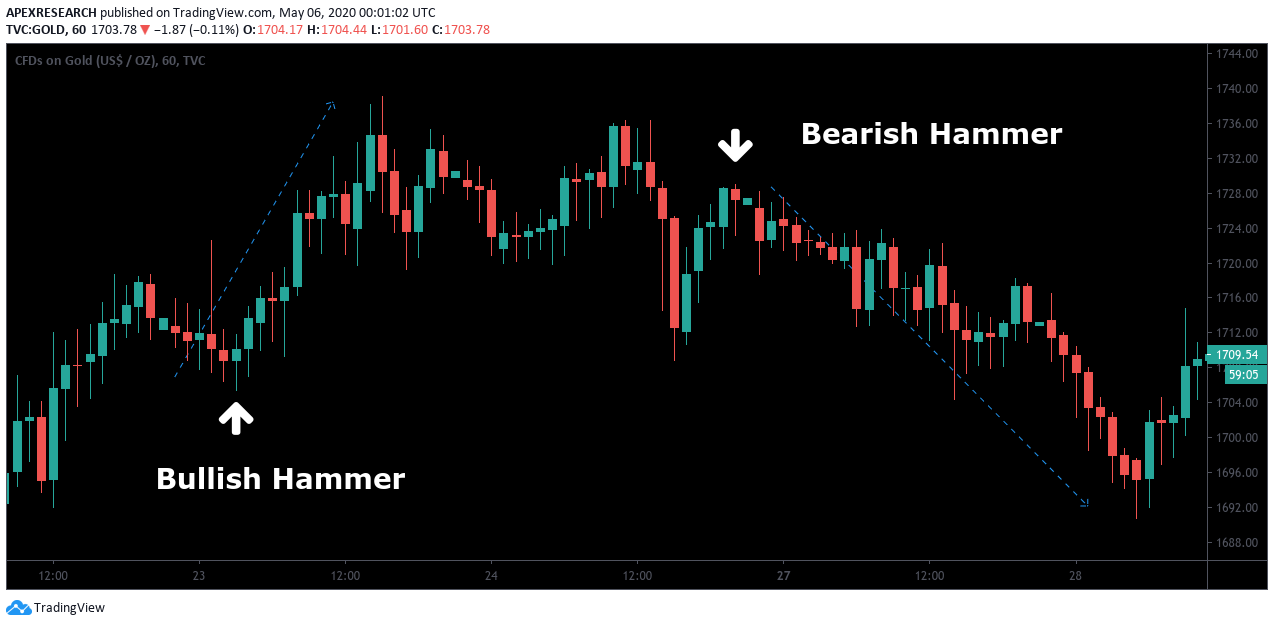
In practical terms, Hammer candlesticks indicate capitulation and a potential reversal in the market’s prior trends. In the chart above, we have outlined two examples of how these events might unfold in real-time. To the left of the chart, we can see that short-term downtrend results in a bullish Hammer formation that quickly sends market prices to new highs. In this case, long positions taken during the time period following the bullish candle would have quickly produced favourable trading gains.
In contrast, a bearish Hammer pattern becomes visible later in the price history and this event works as a precursor to future declines in asset prices. In this case, a trader could have benefited after taking a short position and encountered very little drawdown in the trade. In all of these ways, we can see that the Hammer candlestick formation is an incredibly useful tool for traders in both positive and negative market environments.
Given the nature of the price structure, these patterns tend to be most powerful when they follow a significant downtrend in prices. However, bearish price trends can prove to be just as forceful and the Inverted Hammer candlestick formation provides additional pattern variations that can be used in highly diverse market environments.
PEOPLE WHO READ THIS ALSO VIEWED:


