
What Is The Donchian Channel?
Donchian Channels were designed to identify extreme price moves that can be used to establish swing reversal trades in the market.
The indicator lines that create the outer boundaries of each Donchian Channel are calculated using moving averages (or MAs).
Donchian Channels were originally designed by world-renowned trader Richard Donchian as a way to improve investment efficiency in futures markets.
The Donchian Channel system typically uses candlestick charts to plot lines at the price highs and price lows that are recorded during a specific trading period.
Once plotted, these lines create a channel around market prices that can help to define trading ranges and upcoming trend activity for individual assets.
As a variation on the indicator, many trading platforms will plot a third line in the middle of the channel (middle line), which is calculated by taking the midpoint of the indicator’s upper and lower bands.
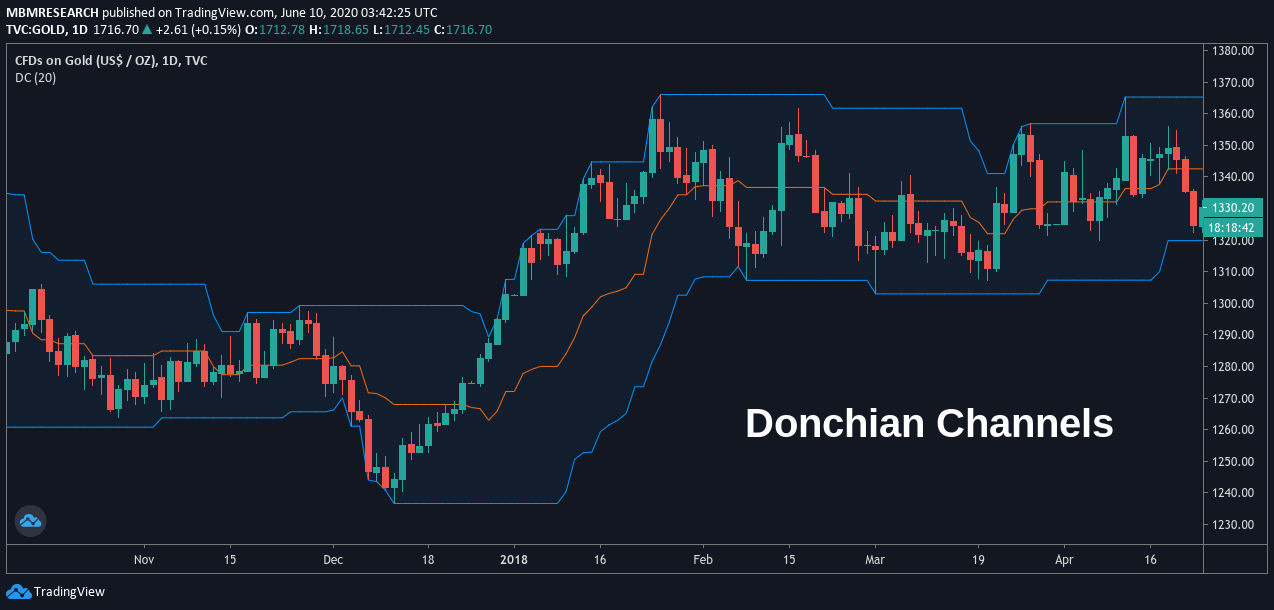
The Donchian Channel’s upper boundary represents the high-point of an asset’s price activity during the charted time interval, while the bottom boundary represents the low-point of an asset’s price action during the same period of time.
How To Use Donchian Channels
Donchian Channels were essentially designed to compare the dynamic relationships that exist between current market prices and the broader trading ranges that are defined by daily volatility averages.
Similar to the boundary lines that are typically associated with the Bollinger Band indicator, Donchian Channel lines are able to create a roadmap for traders that shows the underlying strength of bullish or bearish trends that are currently present in the market.
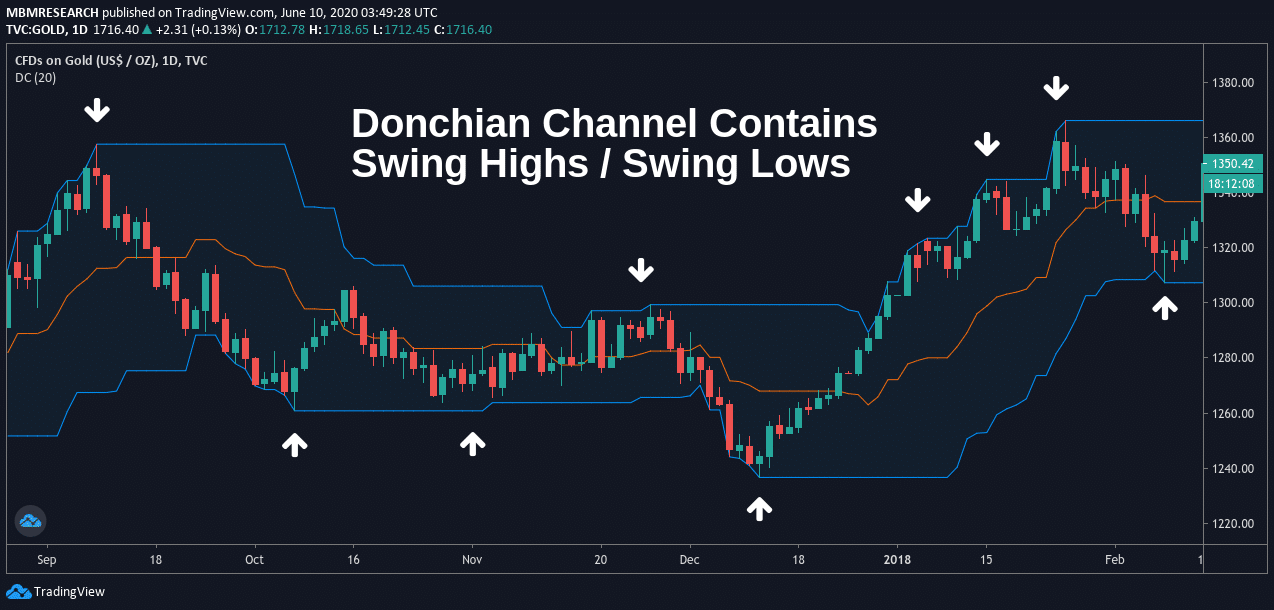
The upper boundary identifies the level of bullish sentiment that is currently present in the market, highlighting the extent to which long positions are likely to produce gains in the sessions ahead.
The centre-point of the Donchian Channel outlines the price median for the trading period, and this can help traders assess whether bulls or bears are currently in control of the market.
The lower boundary identifies the level of bearish sentiment that is present in the market, highlighting the extent to which short positions are likely to produce gains after they are initiated.
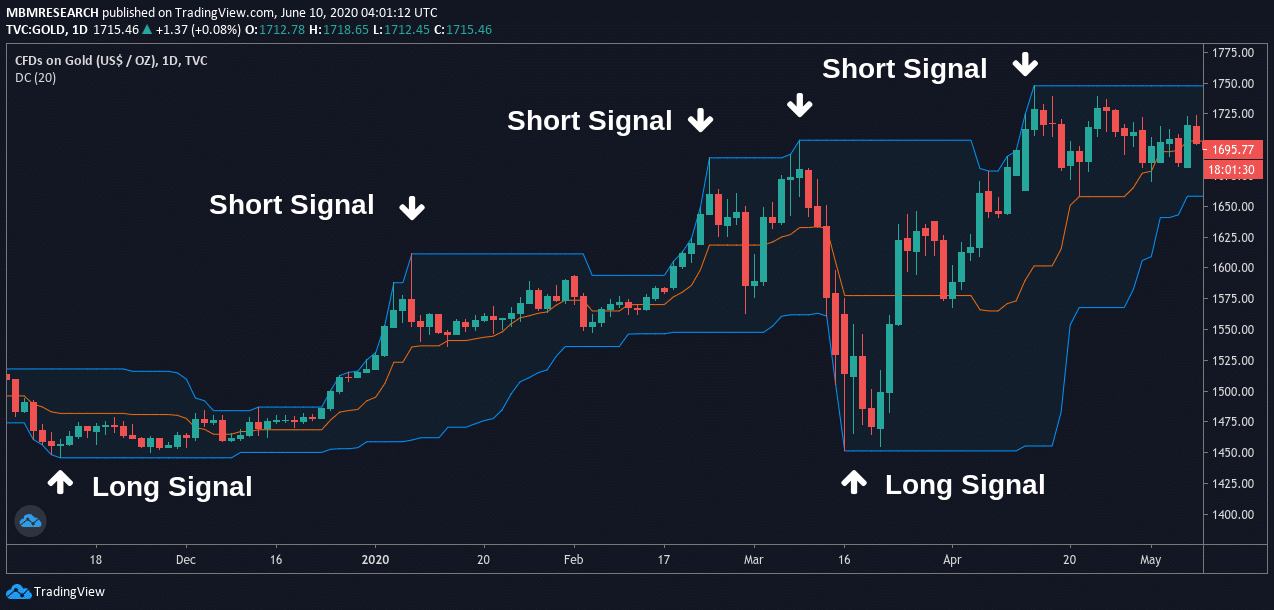
In the chart examples shown above, we can see how the price containment abilities of the Donchian Channel can be used when building a trading strategy for live market positions.
When prices fall to the lower Donchian Channel boundary, traders are likely to begin entering into long positions as a way to benefit from a potential upward rebound.
In contrast, traders are likely to begin entering into short positions when prices move toward the upper boundary because it is unlikely that the uptrend is likely to continue much further.
Donchian Channel strategies can therefore be implemented in both bullish and bearish market environments.
Advantages
Over time, the Donchian Channel has proven itself to be a highly useful trading indicator in terms of its ability to identify market volatility and create a price range that contains the highs and lows of a given time interval.
When asset prices are stable, Donchian Channels narrow to show a constricted range and limited profit potential for day traders.
When market prices fluctuate to a larger degree, Donchian Channel readings will widen and this tends to be the type of environment that lends itself well to trading gains in both directions (bullish and bearish).
In these ways, Donchian Channels can be used by traders looking to establish long positions and short positions depending on the broader trajectory of the market.
Disadvantages
At the same time, it should be understood that markets will generally move in accordance with the underlying financial cycles that are present throughout the global economy.
In practice, the specific time values that are used to plot a Donchian Channel on a technical analysis trading platform might not be a true reflection of the underlying economic conditions that are actually present in the market.
When this turns out to be the case, there is a greater probability that the Donchian Channel will generate false trading signals that have the potential to limit gains and undermine trading performances in the short-term.
Conclusion
In most cases, the Donchian Channel indicator is used as a way of identifying potential swing reversals in the market.
Donchian Channels tend to have the highest success rates when individual price movements become extreme enough to suggest that an asset has become heavily overbought or oversold.
In these ways, they can become highly valuable when traders are looking for new trend moves while they are still in their earliest stages.
Bullish Donchian Channel trading strategies allow traders to go long as market prices fall to the lower boundary and begin reversing higher.

In contrast, bearish Donchian Channel trading strategies focus on short position entries when market prices rise to the upper boundary before reversing lower.
Traders that are looking to incorporate the Donchian Channel indicator into an active trading strategy should consider adding another technical analysis oscillator as a confirming tool because this is often a practice that creates higher probabilities of successful gains over time.
Summary
- Donchian Channels plot indicator lines near the price highs and price lows that are recorded for an asset during a specific trading period, creating a channel around market prices that help define trading ranges and upcoming trend activity for individual assets.
- Donchian Channels tend to work best when traders are able to identify emerging trends and price breakouts while they are still in their earliest stages.
- Donchian Channels can be used when trading in any asset class and on all time intervals, making this a highly versatile indicator for day traders.
PEOPLE WHO READ THIS ALSO VIEWED:


