Fibonacci trading strategies are popular trading tools that use some of the purest mathematical metrics to try to predict trade entry and exit points. The development of the theory dates back to the 12th century and the numerical patterns related to it have been identified across the natural environment, from the proportions of human faces to the patterns of swirling galaxies.
YOUR CAPITAL IS AT RISK
Fans of Fibonacci principles see them as a bedrock of price movement analysis and a way of explaining the ‘natural’ ups and downs of the market, and they are willing to put their money behind trades based on ‘Fib’ analysis.
In this guide, we’re going to look at the following:
Table of contents
What is Fibonacci?
What is Fibonacci, or more accurately, who was Fibonacci? Born in Pisa, Italy, in 1170, Leonardo Bonacci picked up the nickname Fibonacci and had an interest in the Hindu-Arabic numeral system. His research included a simple calculation that, at an initial glance, looks unlikely to help predict much at all, let alone price moves in financial markets.
Taking numbers in order and adding the previous two numbers together, he came up with this file of data:
0, 1, 1, 2, 3, 5, 8, 13, 21, 34, 55, 89…
Note: the process (1+1=2, 1+2=3, 2+3=5, 3+5=8…) starts after the zero and first one.
The pattern interested Fibonacci because however far you take the number sequence, any number in the sequence is 1.618 times larger than the preceding one. This number, Phi, also refers to the Golden Ratio, the mysteriously common ratio relating to patterns found in architecture, geometry, fine art and biology, and including flower petal patterns and the formation of tree branches.
The next step involved inverting the process, dividing any number by the one following it in the sequence and observing the pattern that the resulting number was always 0.618 – for example, 21/34 = 0.618.
Any number divided by the second following number – for example, 21/55 – always equalled 0.3819, and any of the numbers in the sequence divided by the third following number equalled 0.263.
The major Fib levels that are extracted from the list of numbers in Fibonacci’s relatively simple list are 1.618, 1.3819, 1.263 and inverted 0.618, 0.3819 and 0.263. Applied to the financial markets, the theory goes that after a move in one direction, price retracements fall back to one of those Fib levels with an alarming frequency before carrying on in the direction of the initial move.
Fibonacci Retracement & Extension
Fibonacci retracement and Fibonacci extension are two terms that use the same core principles of Fibonacci to explain different types of price moves.
YOUR CAPITAL IS AT RISK
What is a Fibonacci Retracement?
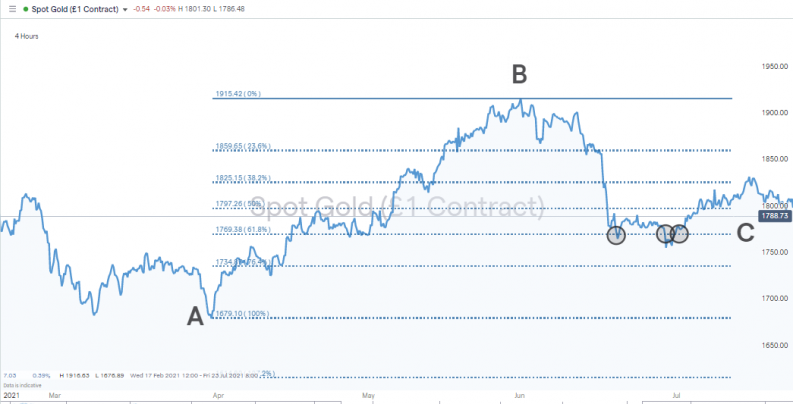
In the below chart, the price of gold rises from $1,679 (A) to $1,915 (B), and when the momentum associated with that move subsides, the price retraces to $1,769 (C), which is the 61.8% Fib level. Price holds at that level, and after consolidating, it then continues its upward movement.
Source: IG
Fib strategies can be used for downward as well as upward price moves. During a different time period, the underlying momentum in the EURUSD currency market was downwards.
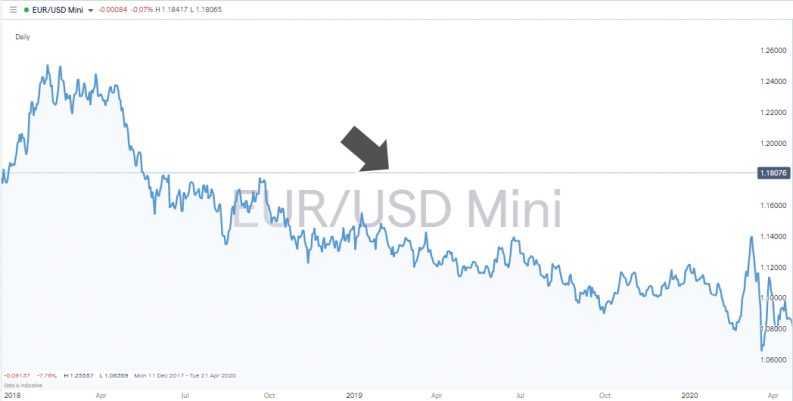
Source: IG
The short-term retracement in the below chart shows the retracement from 1.154 to 1.177 being a short-term price increase to the 23.6% Fib.
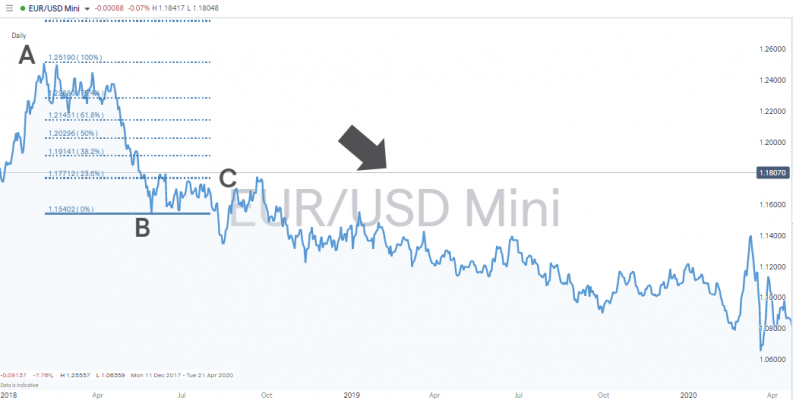
Source: IG
The trick for investors and traders is to be able to spot which peak and trough to use and at which Fib level the retracement is expected to run out of steam. Each Fibonacci level is calculated by dividing the area between the trend high and trend low and applying the Fibonacci sequence ratios.
As a general rule of thumb, the stronger the underlying momentum, the more likely that any retracement would be shorter-lived, and so would the 23.6% Fib. Weaker moves, such as that in the example from the gold market, could see price retrace further to the 61.8% Fib.
YOUR CAPITAL IS AT RISK
What is a Fibonacci Extension?
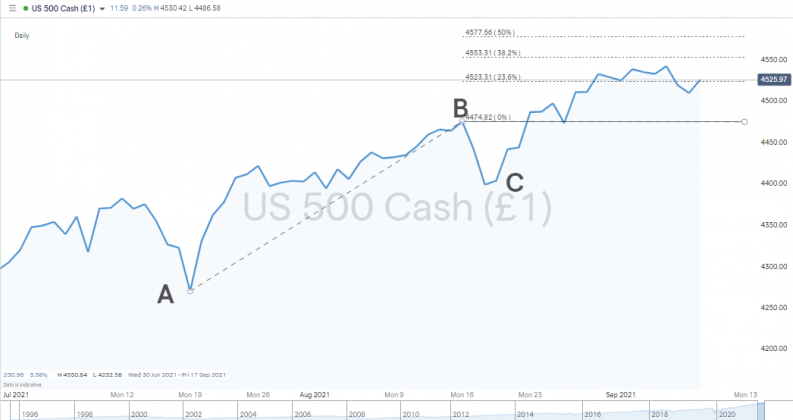
Fib extensions use the same primary data set 0, 1, 1, 2, 3, 5, 8, 13, 21, 34, 55, 89… but invert the ratio, so the key levels to look out for are 1.236%, 1.382% and 1.618%. The below price chart of the S&P 500 stock index shows its upward move A to B, then retrace to C, before carrying on. The Fib extension levels show that the price went higher than 4474 (B) before beginning to consolidate in the region of the 1.236% Fib extension. Those trading a Fib strategy, whether they went long at A or C, or anywhere else along the way, will be able to use the Fib extension levels as target points for exiting the trade.
Source: IG
The keen-eyed will note that 50% and 1.50% tend to also be included as levels in Fib charts. The number is not actually a Fib number generated by dividing or multiplying sections of the series 0, 1, 1, 2, 3, 5, 8, 13, 21, 34, 55, 89… The reason 50% is included in most charting software is that it is such a psychologically important level.
Why Fibonacci Works
As with all trading strategies, there are those who are opponents and proponents of how useful Fib strategies can be. While there are some grey areas around the topic, the below reasons help explain why it is so popular.
Simple but powerful: The core principles of Fib strategies are relatively easy to grasp. Ideas that are easier to understand have a better chance of being adopted more widely.
Natural order: The references found in nature, the patterns of seashells, and the formations of stars offer an intuitive feel that there is something ‘just right’ about Fibs.
A self-fulfilling prophecy: If certain ideas become adopted by a large enough proportion of the market, then that alone can be enough to make them work. Fibs are one of the best-known technical indicators.
Easy to use: The software tools used to overlay the Fib levels involve clicking on a peak and a trough of a price chart, and then all the Fib levels are laid out in front of you. The ease with which Fibs can be found just adds to their appeal.
YOUR CAPITAL IS AT RISK
Developing Strategies Using Fibonacci Levels
As with the examples in the Gold, EURUSD, and S&P 500 price charts, Fibs can be used in any trending market. Retracements and extensions can be identified and used as signals of trade entry and exit points, and it’s only in sideways trending markets where Fib analysis breaks down.
Using Fibs to Set Trade Entry Points: The simplicity of the strategy is that it’s just a case of identifying the initial move and following the pull-back. Some of the skill is learning how to identify which peaks and troughs to use as A and B and which of the choice of Fib levels to use. From there, build a data set to ascertain when and where best to enter.
There is also the case of using Fibonacci levels to work into a position. For example, some capital is allocated at 0.263, some at 0.381, and some at 0.618.
Using Fibs to Set Stop Losses: Not only do Fibs help traders spot entry and exit points, but they also help with risk management. One common strategy is to place stop losses behind a Fib level. This fits in with standard technical analysis, so if the support breaks, then losses are capped.
Trade All Asset Groups: No asset market experiences price moves that go in a straight line. The jagged pattern of peaks and troughs can be found in any sector ranging from crypto to bonds. As a result, you can use Fibonacci levels to trade them.
Trade Short as Well as Long: While stock markets tend to have a natural bias toward gradual upward movement, the forex markets, in particular, have no particular bias toward upward or downward movement. Fibs can be used to spot trade short position entry points.
Incorporating Fibonacci Levels Into Other Strategies: Fib levels are very real-time in nature. They provide an instant update on where the price is in terms of support and resistance levels. However, Fibs can be used as part of other strategies.
The Impact of Time Intervals on Fibonacci Strategies: The general consensus among analysts is that Fibonacci retracement patterns are more reliable if taken over a longer time frame – a 38.2% retracement on a weekly chart being more important than at 38.2% retracement on a 10-minute one.
Which Fibonacci Level is Best? Analysts do tend to prioritise some levels more than others. The 23.6% and 38.2% levels are not as widely referred to as the 61.8% and 50% levels. The fact that those two numbers are the most keenly discussed makes them the ones to watch.
Trading Discipline: Over-trading and impatient trading are two of the fastest ways to lose money. Using Fibonacci retracements to identify trade entry and exit points might not be 100% accurate, but it might stop you from putting on bad trades at the wrong time.
Using Fibonacci With Other Trading Indicators
Fibonacci strategies are one of a long list of technical indicators available to traders. They are very popular and very user-friendly, but one important factor to consider is the benefits of using a range of different signals at the same time.
For example, trading Bitcoin using Fibonacci and moving averages together may improve the strike rate of your trading strategy.


