Trading strategies, which consider the amount and nature of trading activity in any market, work on the basis that they offer an insight into market direction, which price data alone just can’t offer. Make no mistake, price is the ultimate measure of any investment or trading idea and will always be the determinant of profit or loss, but volume-based analysis incorporates other factors.
Building an understanding of the nature of the dynamic relationship between buyers and sellers can be used to create strategies that give an indication of where price may be heading next. There are several popular volume-based trading strategies. All are based on freely available market data and basic maths. However, the subtle differences in how they are calculated means that they offer a slightly different take on market mood. They’ve been around a while so are an established part of technical analysis. Even if you don’t intend to use volume trading strategies yourself, knowing what other traders are using to make their decisions is always a good thing.
Volume Strategies Explained
One analogy to consider is an open outcry trading pit, which characterised most stock and commodity exchanges prior to them being computerised. A day when hundreds of traders are taking part in a huge number of deals and price moves of a small amount is a better indication of market sentiment than one when a handful of traders carry out a small amount of business and price moves a lot.
The day with higher volumes gives a better idea of how the ‘real’ money views the market and a better idea of the direction it will head despite the price move being smaller.
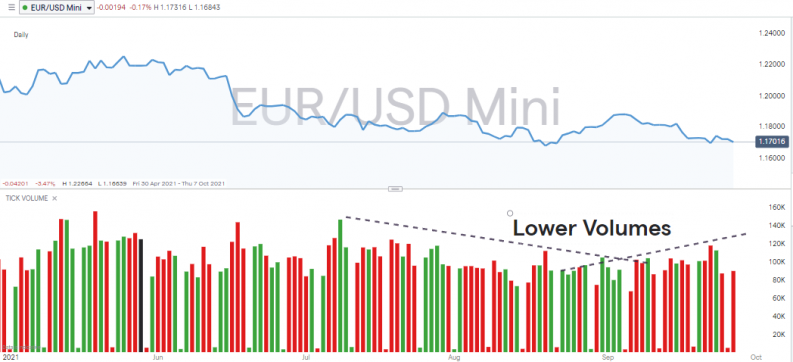
EURUSD Price Chart with Seasonal Drop in Volumes – Daily Chart
Source: IG
- Volume traded: The number of units of an asset traded in a certain time period – most commonly measured daily.
- Volume Weighted Average Price (VWAP): The cash value of all trading periods divided by the total trading volume for the current day.
Measuring this money flow can be done in a variety of ways.
On Balance Volume (OBV)
This measure considers the change in volumes over time. If using a daily timeframe, the volume traded on day two is added or subtracted from the volume traded on day one. On days when the closing price on day two is greater than the closing price on day one, the second period’s volume is added to the previous one. If the closing price in the second period is lower, then the second volume number is subtracted from the first.
The cumulative nature of this sequence continues, so that on day five, the number is added or subtracted from that of day four, which is a number based on the data from days one to four.
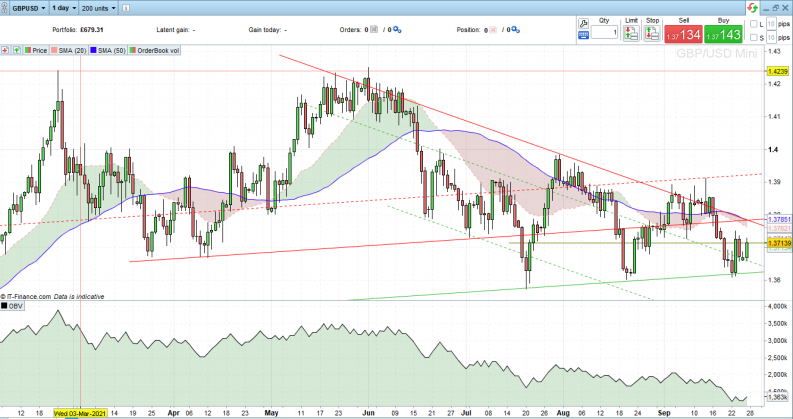
GBPUSD Daily Price Chart – with OBV
Source: IG
The daily price chart for GBPUSD shows OBV declining over a period of months. The key periods to study, and those that back up the credentials as being a leading indicator, are when price is trading sideways but OBV is trending. This represents momentum building up to a point where price then follows the lead provided by OBV.
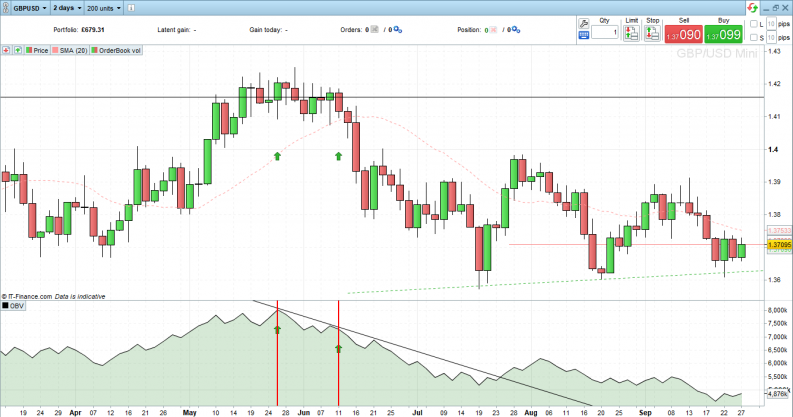
In the below chart of daily GBPUSD prices, OBV starts to trend downwards on 26th May, as marked by the first red bar, but price trades sideways. It’s not until 11th June that price ‘catches up’ and starts to fall. Due to the divergence, the price fall is more extreme from that point and marked an opportunity to sell short based on OBV trending in the previous days.
GBPUSD Daily Price Chart – with OBV – Trade Entry Points
Source: IG
Volume by Price
The Volume by Price measure applies the simple trick of displaying the data on the vertical axis. This switch means that it’s easy to identify the actual amount of an asset traded at specific price levels. As a result, there is an opportunity to spot where the real money is buying and selling in the market.
Keeping a track of the points where institutional investors are getting involved offers a good clue as to the next price move.
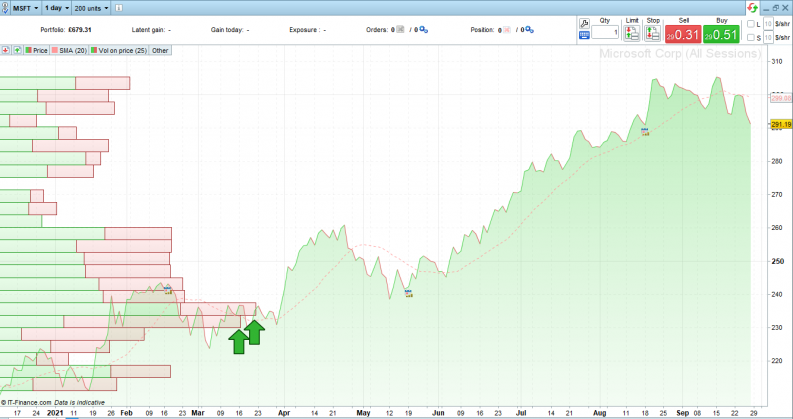
Microsoft Stock Daily Price Chart – with Trade by Volume – Trade Entry Points
Source: IG
The above Volume by Price chart shows the year-to-date price moves for Microsoft stock. The 26bars on the left-hand axis, which protrude the most and display the peak in trading activity, occurred in February, March and April when the stock was trading between $230 and $237.50. In the below chart, it’s possible to see the green segment of the longest bar – which represents buying activity at that price level – extending further out into the chart than all but three other complete candles.
Microsoft Stock Daily Price Chart – with Trade by Volume – Stop Loss Levels
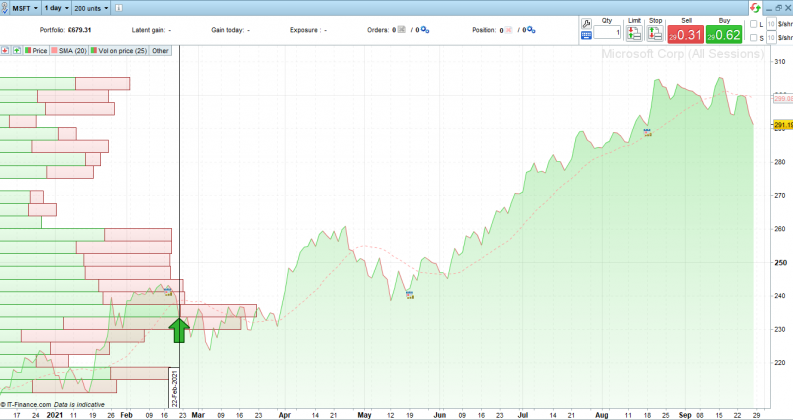
Source: IG
What does this tell us? The subsequent price surge gives a clue. It was at this price range that real money moved into the market to take long positions. This period was preceded by a price fall, and anyone who was still selling in March and April was bailing out and passing their positions on to institutional players such as pension and hedge funds. They built positions by easing into positions over an extended period of time, so as to get in at a good low average price until the moment came when sellers left the market and price rallied.
Tick Volume
Volume-based strategies don’t necessarily need to incorporate clever mathematical principles to be effective. The features on OBV and Volume by Price are nice to have, but even a higher-level view of volumes can help to identify trading opportunities.
Following the core data relating to volumes captures the essence of using trading volumes to spot days when important trends are confirmed. Any day with a spike in trading volume is associated with a greater number of buyers and sellers being involved in coming to a consensus about which way the market is going.
S&P 500 Index Weekly Price Chart – with Tick Volume and Price Crash
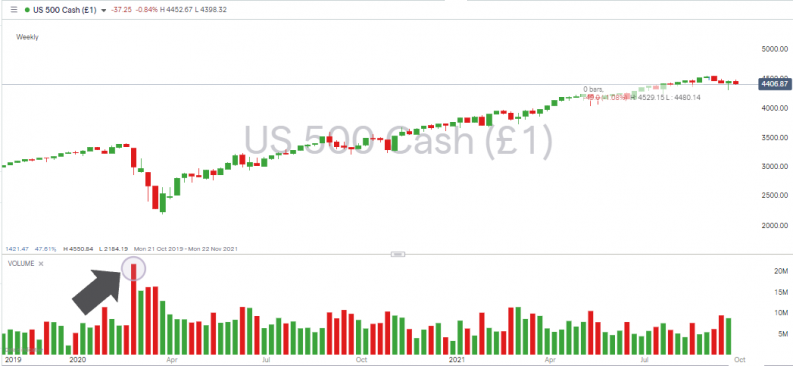
Source: IG
In the week beginning 24th February 2020, trading volumes in the US 500 index spiked from 7,082,554 to 21,703,220. The threefold increase in activity was a major flag that a significant market move was about to take place. The S&P 500 lost 9.6% in value during that week of peak volume, but the aftershocks carried on for some time afterwards, and by 23rd March the index was another 25.67% lower in value.
S&P 500 Index Weekly Price Chart – with Tick Volume Spike and Price Crash
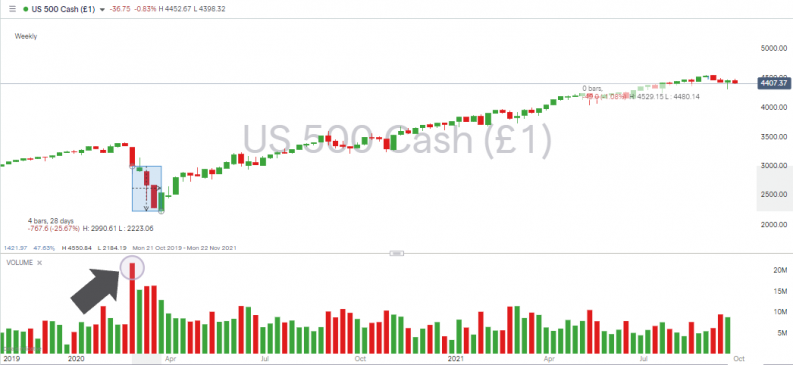
Source: IG
The trading opportunity in the S&P 500 case study was to sell short on the back of the uptick in volume, with a stop loss set above the top of that first weekly candle. As this particular move was part of a major market sell-off, the exit point is not marked by another spike in volume. In fact, the moment that markets turn and head upwards again is associated with a drop in volumes. This reflects ‘normality’ returning to the market and the panic being over. The change in tick volume was a reduction in size, but it still provided a reliable indicator to enter into long positions.
S&P 500 Index Weekly Price Chart – with Tick Volume Drop and Trend Reversal
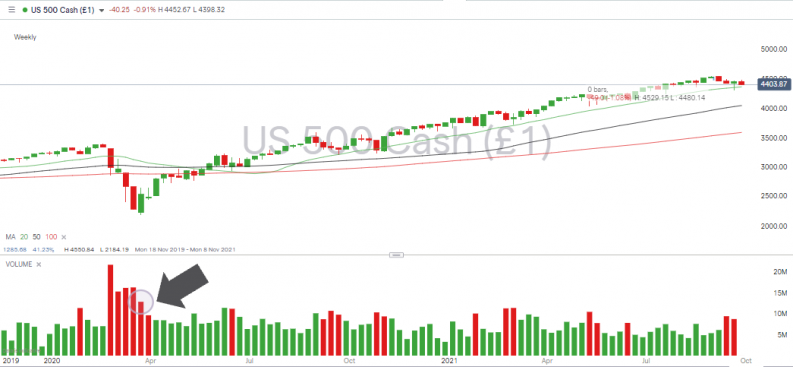
Source: IG
Variations of the Volume Strategy
- Using volume as an indicator doesn’t involve only considering the busier days. Low-volume days are also reliable indicators, and a trading signal from other measures that is not supported by a volume increase could well be a false signal and a trade to avoid.
- Seasonality can also play a part. During the summer months, trading desks at institutional firms are at times manned by junior traders rather than the big bosses who are taking a holiday. The mandate for the junior traders is to act as a safe pair of hands rather than implement a new strategy. Price moves during this period can therefore be exaggerated by there being little appetite for buying or selling. In thin markets, price moves can give a misleading indication of market mood if this is backed up by trading volumes being low.
Big funds, which are the ultimate drivers of prices, are well aware that their actions can distort the market. If the real money is keen on taking a position, it has to build its position with a degree of patience or else its own buying activity can drive price away from the target entry price. They use strategies such as VWAP to help them average into positions, and while the price might not move, the volumes data will. This is why volume trading strategies can offer an insight into the workings of the market and act as a leading indicator of price moves.
Volume Strategy – Trade Entry and Exit Rules & Stop Losses
Tick Volume and OBV offer up valuable information about the state of the market and that something is going on. They don’t offer much specific help in terms of setting trade entry, trade exit points and stop loss limits.
Using Volume for Trade Entry Points
In the case where these measures generate a trading signal, trade execution levels and stop losses would need to be calculated using price-based metrics. A whole range of supporting indicators then come into play, including moving averages, Fibonacci levels and Heiken Ashi candlesticks.
Using Volume for Stop Loss Limits
The Trade by Volume metric does offer a better steer on what price levels are important. It comes down to the data being handily presented on the vertical axis of the chart. In the case of Microsoft, the price range between $230 and $237.50 represents a significant support level. Between February and April 2020, this was the level where real money considered the sell-off in the stock and thought that enough is enough. Stop losses set below $230 would work on the basis that a large segment of the market considers this the point where the stock is undervalued and worth buying.
Using Volume for Trade Exit Points
In terms of trade exit points, volume is again relatively limited in terms of being able to convert the sign that sentiment is changing into an exact price figure at which to close a position. It can signal that exiting a trade might be a good idea, but not necessarily at which price level.
Trade by Volume calculations again have the edge over OBV and Tick Volume because they can illustrate at what level the real money is beginning to close out positions. Other indicators, such as a break of the 10-day simple moving average, would need to be brought into play, particularly if trailing stop losses are to be applied.
Advantages of Using Volume Trading Strategies
- Volume highs are strong indicators because they reflect the amount of interest peaking at a certain price level.
- Volume indicators are market neutral, so they can be as reliable signalling a downturn in price as they are an upward price move.
- They are a tried-and-tested indicator. Having been used for years, they are a signal that many investors and traders look out for, and that in itself can be self-fulfilling in terms of their effectiveness.
- Moments of extreme volume, which are accompanied by dramatic price moves, can result in the markets moving out of the financial press and into the mainstream news flow. If passive investors are triggered to buy or sell as a result, then this brings greater momentum to the trend that is forming.
- Trading with trends is key to making a positive return. High-volume days often occur when an old trend is ending and a new one is forming. Getting in at the start of a trend maximises the potential gain as positions will run for longer.
- Many price-based technical indicators are limited by the fact that they are lagging indicators. They show where price has been, rather than where it is heading. An uptick in volume suggests that something is happening at that moment and so volume is more of a leading indicator than price.
- Systematic trend-following strategies account for an increasing amount of trading activity. Algo-based hedge funds that follow trend strategies incorporate a whole range of data points when determining whether to trade or not. One of these metrics is volume, so if some of the biggest players in the market are using volume as a guide, it makes sense for smaller traders to do the same.
- Discipline is a key element of successful trading. Volume strategies help novice traders to get past the temptation to enter into trades too early and to avoid false signals produced by other indicators.
- Monitoring volume can help traders to navigate the calendar year. Summer months are associated with fewer new trends forming, and if volumes are subdued during that time, then range-based strategies may be more appropriate than ones based on breakouts.
- Monitoring volume can encourage traders to develop new skills and look for different explanations to market moves. Low-volume markets that do experience a price breakout, such as those associated with the Santa Claus Rally, can be explained by factors other than there being a long-term trend forming based on fundamentals.
- The strategy is easy to follow, and Tick Volume data at least is commonly provided free of charge by good brokers.
- Making the right call on a breakout, getting in at the start of a trend, and trading with market momentum rather than against it are key to successful trading.
- Volume can also be used to spot the end of a trend and a time to consider exiting a position.
Disadvantages of Using Volume Trading Strategies
- Volume indicators confirm that something is going on, but not necessarily whether the current trend will reverse, or if price is just moving through a considerable price support/resistance level.
- Not only is the direction not confirmed, but also volume OBV and Tick Volume are limited in terms of being able to provide trade entry, trade exit and stop-loss levels.
- OBV and Trade by Volume indicators are provided free of charge by some brokers, but some keep the tools behind a paywall and require traders to sign up to a premium-grade account.
- A dramatic increase in volume can be a sign of market panic. It might well be that the volume indicator is correct, but trading high volatility markets comes with additional risks, most notably that emotions may blur judgement.
- While technical analysis is at the heart of the strategy, fundamental factors also need to be considered. If the spike in volume is due to a sudden geopolitical event or an earnings announcement, then it’s less likely to be an OBV-style signal that real money is building a position over a period of time.
- There are a number of common problems that explain why technical indicators fail.
Other Strategies That Work Well With Volume Indicators
Volume strategies are great at providing a clear indicator of a potential breakout, but all indicators benefit from being used in conjunction with others. Whatever your trading style, incorporating signals from the below strategies can improve trading performance:
When considering what else to incorporate into a volume-based strategy, it is also worth questioning the chosen timeframe. Adjusting chart timeframes from one hour, to one day, to one week can offer a different view of the situation.
The Bottom Line
Successful trading is based on spotting the direction in which most of the market is heading, and volume-based strategies offer a clue to sentiment shifting. One potential hazard to watch out for is that a volume spike is due to a support or resistance level being tested, rather than a full-blown reversal forming. Another disadvantage is that volume strategies can point to something happening in the markets, but converting this into price entry points requires the use of other indicators.
Volume is an important metric to follow. A lot of other strategies, such as trendline breakouts, work more effectively when volume is incorporated into the decision-making process. Strategies that use volume as a primary indicator, such as OBV and Trade by Volume, tend to be more effective in quieter markets when it’s easier to spot the moves made by ‘real money’. However, when they work, they can offer a chance to get into a trend at the very start of its move.
Further Reading
- This article revisits some of the basic principles of volume trading and how to use it.
- Using volume in conjunction with swing lows can help to determine if a trend is set to continue.
- If you need to fill in some gaps in your analysis, head here to find out about other indicators used to spot trends.
- Trend reversals and the moment that new trends start are considered in this article, which analyses V-bottom trading strategies.


